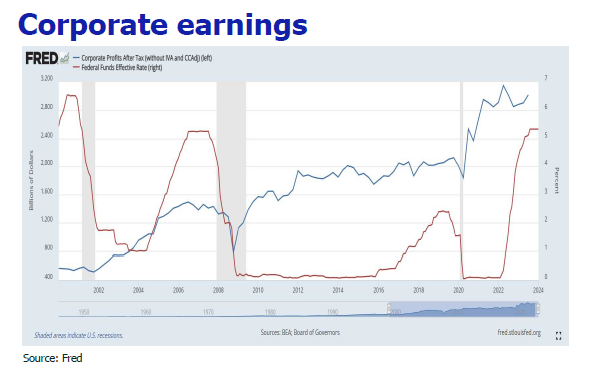
Return of inflation pressure brings down rate cut expectation
Austin Or, CFA
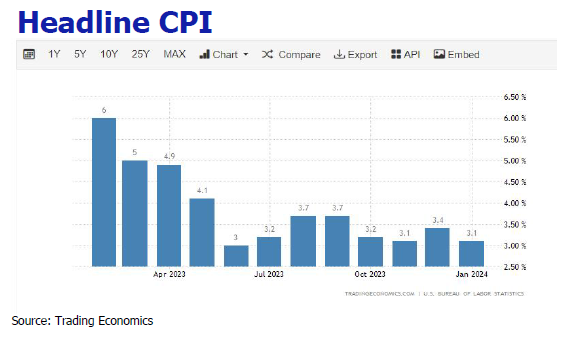
Core CPI recelerated
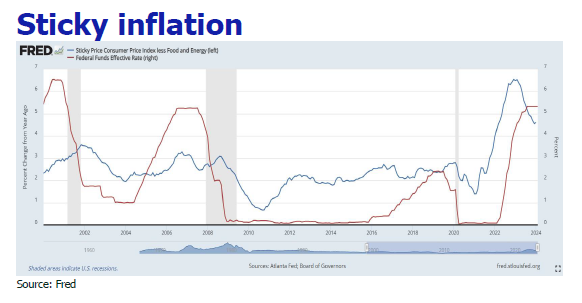
The U.S. CPI increased by 3.1% yoy in January, higher than the expected increase of 2.9%; and increased by 0.3% mom, higher than the expected increase of 0.2%. The core CPI increased by 3.9% yoy in January, higher than the 3.7% expected, remained flat with previous month yoy growth; and increased 0.4% mom in January, the largest increase in eight months, higher than the expected 0.3%, and higher than the previous month value of 0.3%. The rise in a wide range of service industries prices outweighed the falls in commodity and energy prices. The prices of transportation services, especially core services such as air tickets, vehicle insurance and maintenance, medical care services, and hotel rentals, increased significantly mom, causing core service items to increase by 0.7% mom; core commodity prices fell by 0.3% mom, including used car prices and clothing commodity prices. The energy item fell by 0.9% mom, mainly due to the significant mom decrease in fuel and gasoline prices, which offset the increase in electricity prices.The super core CPI service index excluding housing surged 0.7% mom, the largest increase since September 2022, and the yoy increase was as high as 4.4%, the largest increase since May 2023. Housing contributed two-third increase to the overall CPI increase, and is the main driver for the rise in CPI.
PCE mom growth was pumped by service inflation
Although the housing sector indicator does not account for as much in the PCE price index as the CPI, the January PCE data echoed the January CPI index, which also showed an acceleration in the pace of rising costs of goods and services. Excluding food and energy, the core PCE price index growth rate in January fell back to 2.8% yoy, slightly lower than the 2.9% in the previous month, and it was the smallest increase since March 2021, in line with market expectations, but the mom growth rebounded to 0.4%, higher than the 0.2% growth in the previous month, registering the largest increase since April 2023. Service inflation was the main driver for the PCE acceleration. The growth rate of service industry inflation excluding housing increased by 0.6%, the highest level since March 2022, and each component of the super core increased mom.
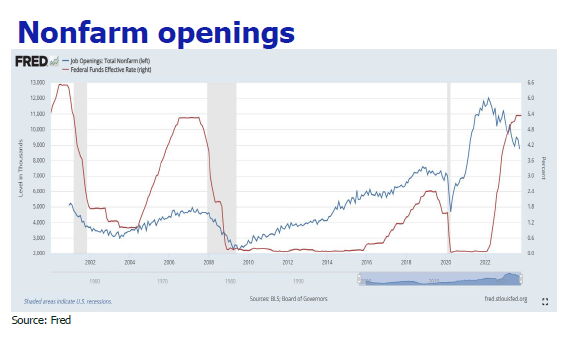
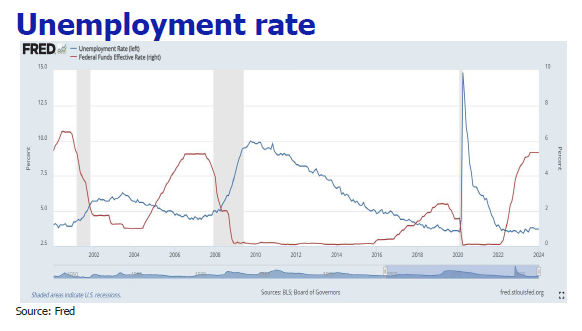
January non-farm payroll soared, wage growth heated up.
The U.S. non-farm employment population increased by 353,000 in January after seasonally adjustment, which was the largest increase since January 2023 and exceeded the expected increase of 187,000. Job growth in January came primarily from health care, professional and business services, and retail sales. Growth was led by professional and business services, which added 74,000 jobs, followed by health care (70,000), retail trade (45,000), government (36,000), social assistance (30,000) and manufacturing (23,000). The U.S. unemployment rate remained stable at 3.7% in January, below the expectation of 3.8%. Hourly wages increased by 0.6% mom, the largest increase since March 2022, and the you growth increased to 4.5% from 4.1% last month.
Manufacturing PMI hits 17-month high, driving U.S. economic growth.
Benefiting from strong order growth, the preliminary value of the manufacturing PMI in February was 51.5, higher than 50.7 in January and higher than market expectation of 50.5. There has been a pleasant return to growth in the manufacturing sector, with industrial output growing at its highest level in 10 months and producers recording the fastest employment growth since September 2023. Better weather conditions outweighed shipping issues and helped drive an overall improvement in supplier delivery times compared with January, boosting factory output. Preliminary data from the February PMI showed that the U.S. economy continued to expand in the middle of the first quarter, with annualized GDP growth expected to be around 2%.
Consumer retail sales and consumer credit slammed the brake.
U.S. retail sales fell 0.8% mom in January, a much sharper decline than expected, as cold weather across the U.S. prompted consumers to stay home, dragging down revenue from car dealers and gas stations. On the other hand, consumer credit growth plummeted to 0.4% from the previous 5.7%, the lowest since August last year. At the same time, a credit report released by the New York Fed last week showed that in the fourth quarter of 2023, consumer credit card and auto loan delinquencies across the United States reached the highest point in more than a decade. Growth in consumer spending is gradually normalizing due to high interest rates and savings rates, which will also contribute to a future economic slowdown.
Prediction
1. CPI should soften later but the pace is slow and murky.
The increase in January inflation data may be a one-time event, in our view. One, the companies readjust their prices at the beginning of the year, with prices for labor-intensive services such as medical care and car repairs rising particularly sharply to keep up with rising labor costs. Two, the newly adopted weighting scheme of the CPI index increases the proportion of housing prices and reduces the proportion of new and second-hand car prices, which amplifies the the impact of housing prices on the increase in CPI.
The CPI should still keep steering to the down track despite the short term spike. The longer the U.S. high interest rate policy is maintained, the high borrowing costs will inevitably hurt U.S. consumer demand as well as corporate hiring and expansion plans. In addition, current signs indicate that rental demand is declining and a large number of apartment buildings are under construction, setting to turn down rents and inflation going forward. A CNBC survey of economists shows that by the end of 2024, the average U.S. inflation rate will fall to 2.7%. And, according to forecasts by Federal Reserve officials, due to the signifiant decelerated growth of the U.S. labor market this year, PCE will fall to 2.4% and the core inflation rate after excluding food and energy prices wil drop to 2.4%.
However, these will not come straight as wages grow faster than inflation and the manufacturing industry returns to expansion. A sample survey from the National Federation of Independent Business (NFIB) revealed that in the past three months, the number of companies that answered “yes” to raising prices in the next three months has jumped from 20% to nearly 40%, suggesting that the pace of CPI decline would be slower and more bumpy than expected.
2. Strong inflation reading and non-farm payroll hold back rate cut progress and intensity
As the inflation appears sticky again, we anticipate that the Fed will not initiate rate cut in March and May but make it in June instead. FOMC dot plot implies that the size of rate cut will be 75 bp rather than 100 bp or higher as speculated by the market, and we believe total rate cut in 2024 will likely fall short of market expectation as well due to the resilient labor market and the slowing cool down of inflation.
3. US economy would achieve soft landing
According to the National Association for Business Economics, the U.S. economy is expected to grow by 2.2% this year after adjusting for inflation. The solid job market, the strong consumer spending and the investment frenzy in AI will provide support for US economic growth in the short term. Besides, inflation has gradually be tamed and rate cut is expected to start in mid-June this year. Therefore, we reckon that US economy is skewed to soft landing now.
Disclaimer
All information used in the publication of this newsletter has been compiled from publicly available sources that are believed to be reliable, however we do not guarantee the accuracy or completeness of this report and have not sought for this information to be independently verified. Forward-looking information or statements in this report contain information that is based on assumptions, forecasts of future results, estimates of amountsnot yet determinable, and therefore involve known and unknown risks, uncertainties and other factors which may cause the actual results to be materially different from current expectations.
We shall not be liable for any direct, indirect or consequential losses, loss of profits, damages, costs or expenses incurred or suffered by you arising out or in connection with theaccess to, use of or reliance on any information contained on this note.