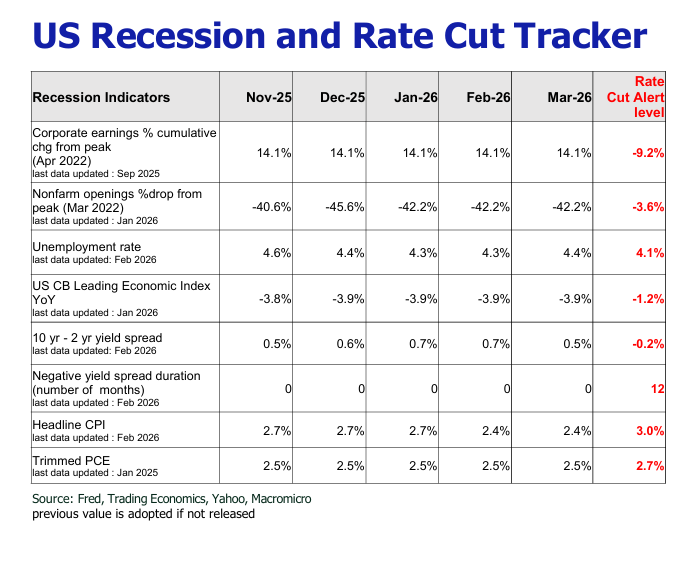
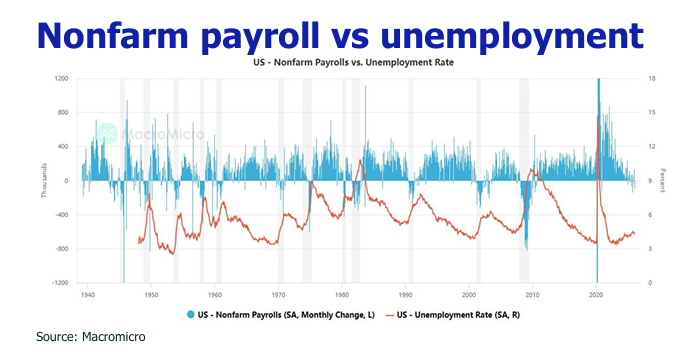
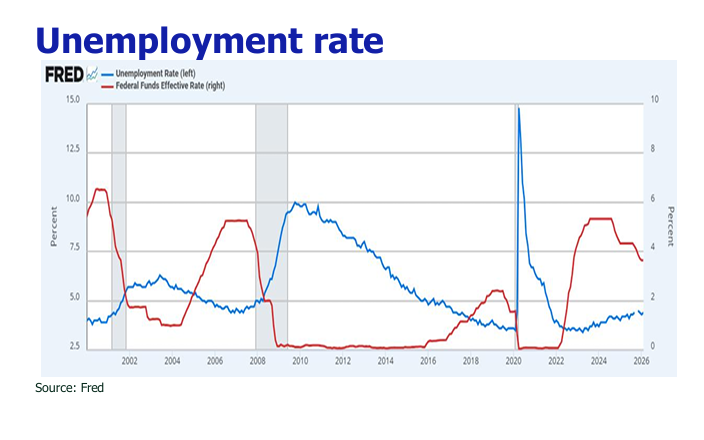
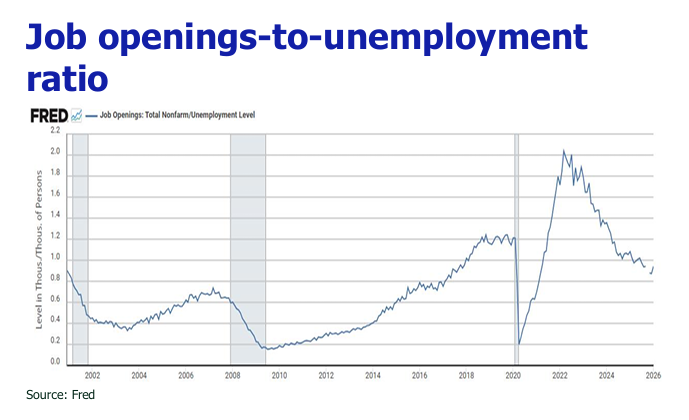
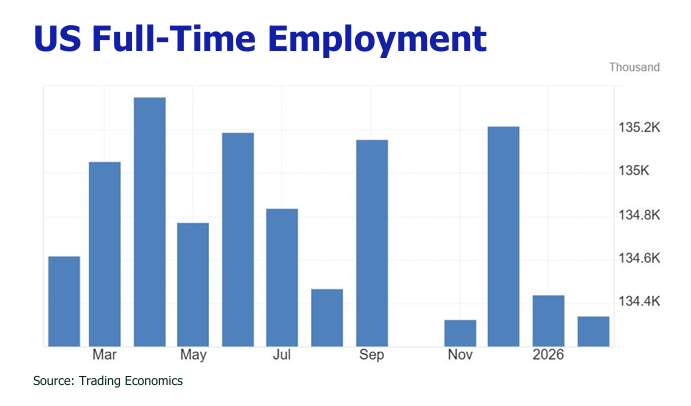
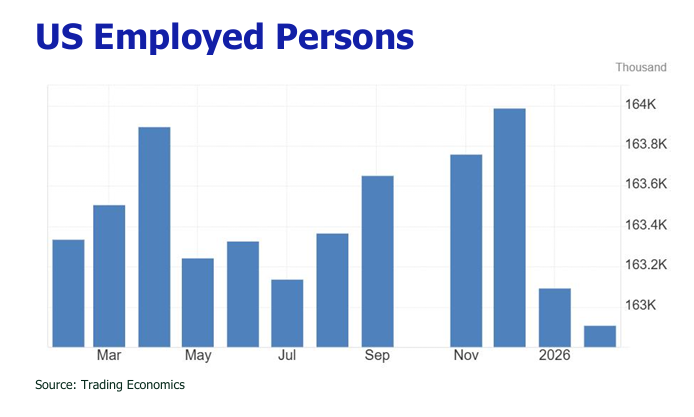
Market reels as stagflation fear and prolonged Iran-US-Israel conflict intensify

Austin Or, CFA

Highlights

Nonfarm payrolls fell by 92,000 in February—the third decline in five months—with unemployment rising to 4.4%, the highest since November of the prior year.
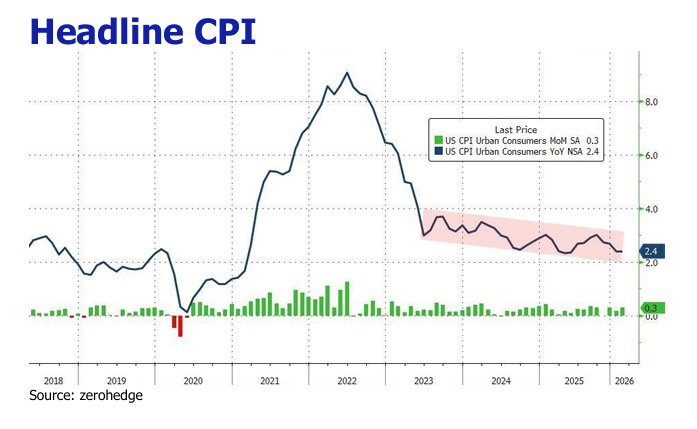
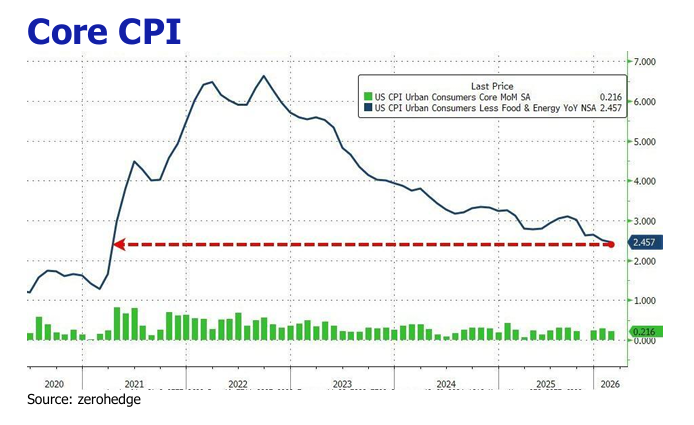
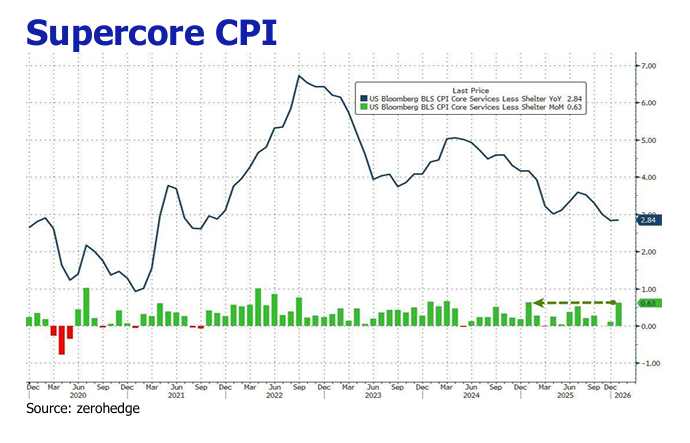
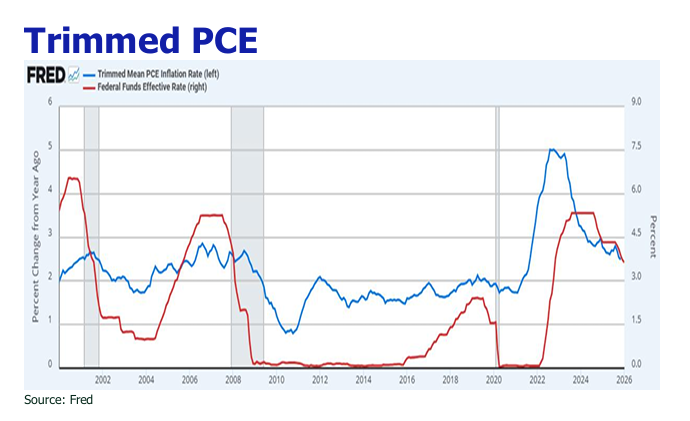
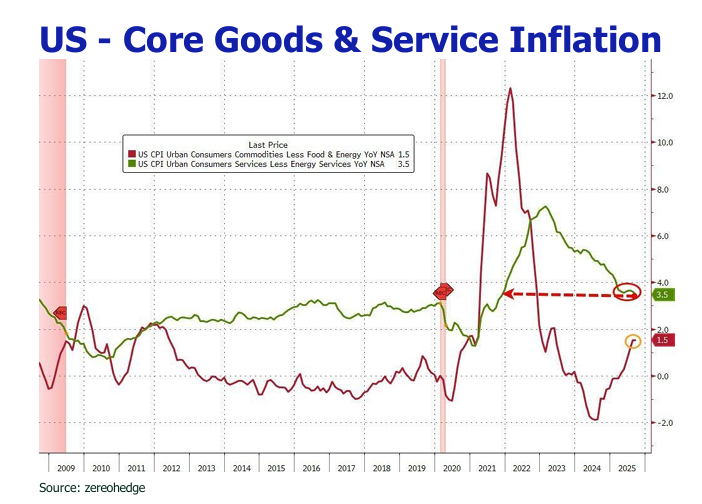
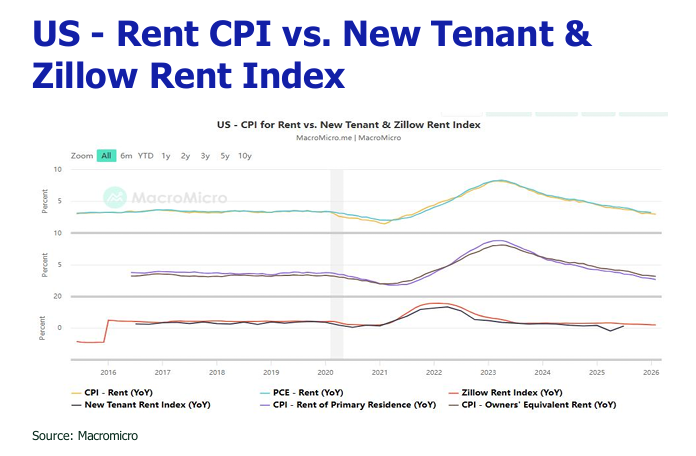
Headline and core inflation held steady at 2.4% and 2.5% year-over-year, respectively, with monthly gains of 0.3% and 0.2%.

Brent crude surged over 23% to $110/bbl, gold tumbled 16–20%, silver plunged 22–30%, driven by the Federal Reserve’s pivot to higher-for-longer rates, a strong dollar, and fears of reduced industrial demand.

US markets slid 5%; China’s benchmarks shed 4–6%; Japan’s Nikkei fell 5–7%, Korea’s KOSPI plunged 6–8% as the US 10-year yield hit 4.40%.

The U.S. dollar strengthened (+3%) significantly as a safe haven, while the Japanese yen (-1.9%) and South Korean won (-4.1%) weakened under the pressure of soaring energy import costs and economic vulnerability.

Severe supply constraints and insufficient mitigation measures are expected to keep oil prices elevated above $100 per barrel for the near term, with potential for extreme spikes to $130-$150 if supply disruptions continue longer than anticipated.
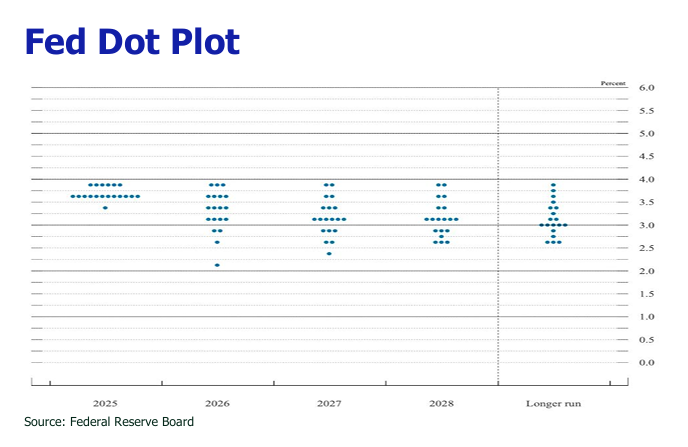
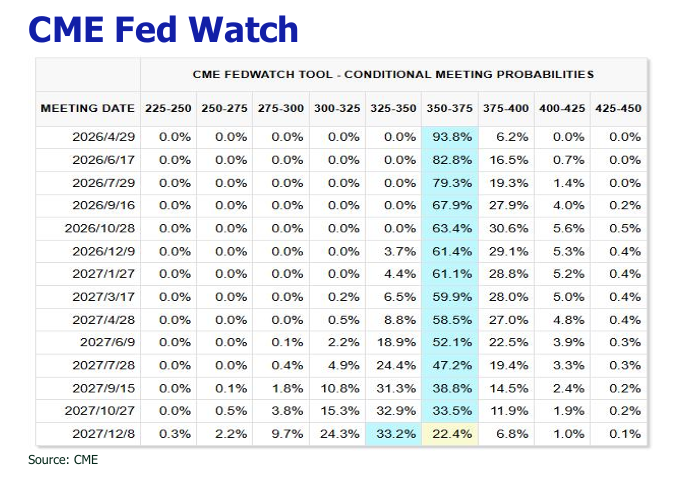
The Federal Reserve is expected to delay rate cuts until late 2026, with the possibility of no easing at all if oil prices surge further.

Weak labor market data and political pressure will likely prevent the Fed from hiking rates, forcing it to tolerate temporary inflation to avoid triggering a recession.

Rising stagflation risks favor defensive investment strategies, shifting focus away from traditional growth stocks toward energy, gold, and value sectors.

The Hang Seng Index dived 6% to around 25000, with daily turnover surging to HK$250-400 billion, driven by global risk-off positioning.

Subdued labor market signals

Nonfarm payrolls contracted by 92,000 in February, falling short of the downwardly revised January figure of 126,000. This marked the third monthly decline in the past five months, following a revised drop of 17,000 in December. At the same time, the unemployment rate climbed to 4.4% from 4.3%, reaching its highest level since November of the prior year. Losses were broad-based across key sectors, including government (-10,000), healthcare (-28,000), leisure and hospitality (-27,000), retail (-25,000), manufacturing (-12,000), professional services (-10,000), transportation and warehousing (-11,000), and information (-11,000). Although the report was distorted by one-off factors such as healthcare strike activity and severe winter weather in certain regions, the underlying softness underscores a clear cooling in the labor market.

Tranquil CPI before the impending oil shock

US consumer prices rose 0.3% month-over-month in February, while core CPI (excluding food and energy) advanced 0.2%. Both headline and core inflation held steady at 2.4% and 2.5% year-over-year, respectively. Notable contributions came from a 0.4% increase in food prices, a 0.6% rise in energy, and a 0.2% uptick in shelter. Early signs of tariff pass-through appeared in appliances (+3.1%) and apparel (+1.3%). Although February’s CPI print appeared relatively benign, it represents the calm before the storm, as surging gasoline prices in March are poised to exert upward pressure on inflation in the coming months.

Oil: The epicenter of volatility

Oil markets were roiled by the US-Iran conflict in March, exacerbated by the partial closure of the Strait of Hormuz, through which nearly 20–30% of global oil transits. Brent crude surged past $110 per barrel on multiple occasions, peaking near $112, fueled by attacks on energy infrastructure in Iran and Qatar and fears of further strait disruptions. Between March 2 and 23, Brent advanced nearly 23.4%. Prices then suffered their largest single-day drop in years (over 10%) on March 23 following President Trump’s announcement of a five-day pause in strikes and claims of “productive discussions” with Iran. However, the rebound was swift the next day after Iran denied any negotiations and the US signaled plans to deploy additional forces to the region.

A dramatic reversal in gold and silver

Gold experienced a sharp reversal, declining approximately 16–20% from its early-March highs of $5,370–$5,600/oz to around $4,370–$4,650/oz. Silver fared even worse, plunging 22–30% from $91-$121/oz to $65–$72/oz, erasing all year-to-date gains and turning negative for the year. The sell-off was propelled by shifting Fed expectations toward a higher-for-longer policy stance, a stronger US dollar, rising Treasury yields, profit-taking, and the unwinding of leveraged positions. Silver’s outsized decline was amplified by its substantial industrial demand (over 60%, including solar, EVs, and electronics), as fears of economic slowdown weighed heavily on consumption expectations.

Global equities under pressure

March 2026 saw pronounced volatility and a clear risk-off tone across major equity markets. The US market (S&P 500 and Nasdaq) retreated by around 5%, while China’s Shanghai Composite and CSI 300 underperformed, falling 4–6% amid persistent US tariff headwinds and subdued domestic data. Japan’s Nikkei 225 swung dramatically, dropping as much as 8–10% intra-month before a modest rebound, ultimately closing down 5–7%. South Korea’s KOSPI was the most volatile, plunging over 12% in a single session early in the month before a partial recovery, ending with net losses of 6–8%. The primary catalyst was the escalation of geopolitical tensions in the Middle East (US-Iran conflict), which triggered a sharp oil price spike above $100–$110 per barrel. This reignited global inflation fears, raised concerns over squeezed corporate margins and reduced household disposable income through higher fuel and transport costs, and prompted a broad rotation from equities into safe-haven assets. Energy-importing economies such as Japan and Korea were hit hardest due to elevated input costs, while China experienced secondary pressure despite some insulation from Middle East energy shocks via strategic reserves and diversified supply routes.

Treasury yields surge

US Treasury yields rose sharply in March, with the benchmark 10-year yield climbing from below 4% at the end of February to 7.5-month highs near 4.40% by mid-to-late March. This marked a significant repricing in the bond market, driven by renewed inflation concerns stemming from the oil shock, the evaporation of near-term rate-cut expectations, and a rapid unwinding of leveraged bond positions.

Stronger USD, Weaker JPY and KRW

The US Dollar Index gained roughly 2.5–3.1% in March. The dominant driver was the geopolitical escalation in the Middle East, which triggered classic safe-haven demand for the dollar. Surging oil prices reignited inflation fears, prompted markets to price in fewer Fed rate cuts, and pushed Treasury yields higher. In contrast, the Japanese yen and South Korean won weakened by approximately 1.9% and 4.1% against the dollar, respectively. As major energy importers, both Japan and Korea faced immediate cost pressures from higher oil prices, which transmit directly into key export sectors such as semiconductors, automobiles, and chemicals.

Prediction

1. .High oil prices to persist; the worst is yet to come.

Current oil traffic through the Strait of Hormuz has fallen to between 3.5 and 5.5 million barrels per day—a steep decline from the normal 20 million barrels per day that passed through before the war. Over 6 million barrels per day of Gulf production remain offline due to the destruction of oil facilities. Temporary mitigation measures—including pipeline bypasses, strategic petroleum reserve releases, and the Russia export waiver—can offset only an estimated 25–30% of the losses. Given the yawning gap between the negotiating positions of Iran and the US, a ceasefire or de-escalation appears improbable in the near term. Consequently, the Strait of Hormuz is likely to remain partially blockaded, anchoring oil prices above $100 per barrel in the coming months.

The lag in supply recovery means that even with a diplomatic breakthrough, $100+ per barrel oil is poised to become the new baseline for the foreseeable future. Consensus forecasts point to sustained high prices—$95–$110 in the near term, averaging $95 for full-year 2026, and $100 per barrel in 2027—persisting for months even if fighting subsides, owing to the protracted nature of supply restoration.

Strategic petroleum reserve releases and Russia sanctions relief can temporarily restrain oil price appreciation for roughly three to four months (and at most six months) while Iran continues to impede traffic through the Strait of Hormuz. However, if disruptions persist longer—for instance, ten or more weeks of severely curtailed flows coupled with a sustained 2 million barrels per day loss—Goldman Sachs and Citi warn that prices could spike to $130+/bbl or even eclipse the 2008 record high of $148.

2. Inflation to surge while growth decelerates.

The current oil shock is expected to add 0.7–1.2 percentage points to headline CPI over 2026, with the bulk of the impact concentrated in the second and third quarters. CICC estimates that if oil averages $100 per barrel in 2026, US CPI could rise to 4.0%. Under a more severe “major risk” scenario involving a six-month disruption of the Strait of Hormuz, CICC projects US CPI could reach 4.4%. Oxford Economics’ worst-case scenario—$140 oil for two months—predicts US inflation could peak around 5.0% in the second quarter.

Sustained high oil prices (averaging $95–$100 for 2026) now represent the single largest downside risk to US growth. Consensus forecasts have been revised downward from roughly 2.1% to 1.4–1.7% for 2026. The growth drag is expected to be most pronounced in Q2 and Q3 2026, as tariff and oil pass through effects peak simultaneously. Should the Strait of Hormuz remain obstructed and oil prices stay above $110, GDP growth could slip below 1.2%, materially elevating stagflation risks.

3. Fed to delay or forego rate cuts; High bar for hikes.

Under elevated inflation risks, Fed officials continue to pencil in a 25 basis point cut in both 2026 and 2027. We anticipate the first rate cut of 2026 will materialize in the third or fourth quarter, with only modest easing—totaling 25 basis points—for the full year. Should oil prices surge to $120–150+/bbl—a plausible scenario if Hormuz disruption deepens or supply recovery is delayed beyond Q3—rate cuts may be shelved altogether.

If oil prices spike to $120+, the Fed is likely to hold rates steady or merely pause cuts rather than actively hike, constrained by labor market fragility and political pressures. The February 2026 nonfarm payroll report already registered a-92,000 job loss—the first outright contraction in years—and
unemployment has climbed to 4.4%. A further oil-driven slowdown could push it toward 5% or higher. The Fed’s dual mandate accords equal weight to maximum employment; hiking into a softening labor market risks precipitating a recession, an outcome the central bank is keen to avoid. Additionally, the Trump administration’s preference for low rates to support growth, equities, and housing would likely subject any rate hike to public criticism from the White House, making the Fed even more cautious. In this context, the Fed would likely tolerate temporarily elevated inflation rather than risk tipping the economy into recession.

4.Stagflation plays draw spotlight.

With oil prices anchored near $100/bbl amid the Middle East supply shock, softening labor data, and persistent core inflation, the specter of stagflation is increasingly commanding investor attention. The Fed now confronts a classic policy bind: tighter policy to combat inflation risks exacerbating the slowdown, while easier policy could allow inflation to re-accelerate. In this regime, traditional growth stocks and long-duration assets are expected to underperform, while stagflation-resilient themes — energy, gold, defensive value stocks (consumer staples, utilities, and healthcare), and real assets (HALO) — are drawing strong market interest and are poised to benefit.

Disclaimer

All information used in the publication of this report has been compiled from publicly available sources that are believed to be reliable, however we do not guarantee the accuracy or completeness of this report and have not sought for this information to be independently verified. Forward-looking information or statements in this report contain information that is based on assumptions, forecasts of future results, estimates of amounts not yet determinable, and therefore involve known and unknown risks, uncertainties and other factors which may cause the actual results to be materially different from current expectations.

We shall not be liable for any direct, indirect or consequential losses, loss of profits, damages, costs or expenses incurred or suffered by you arising out or in connection with the access to, use of or reliance on any information contained on this note.