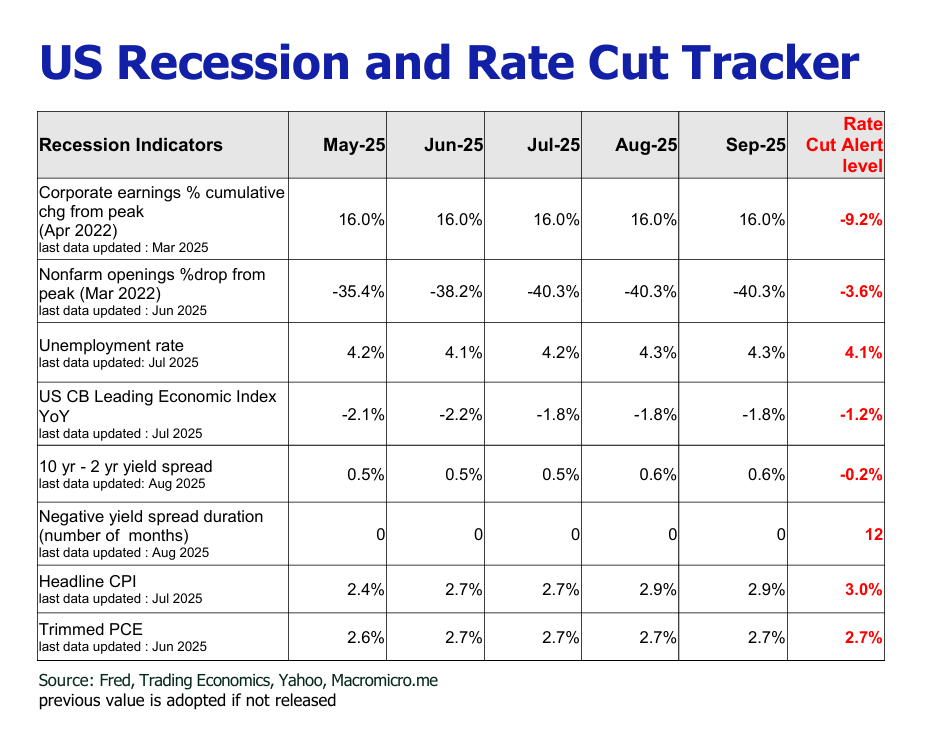
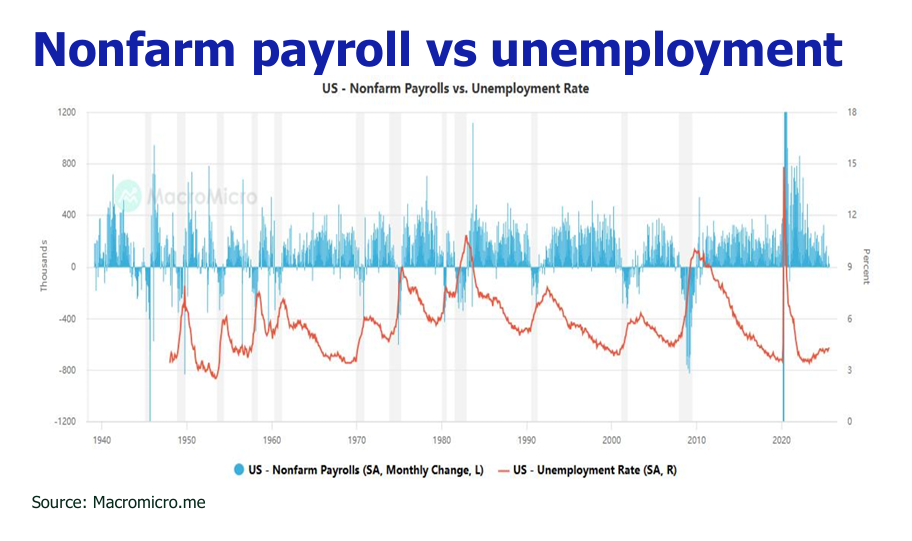
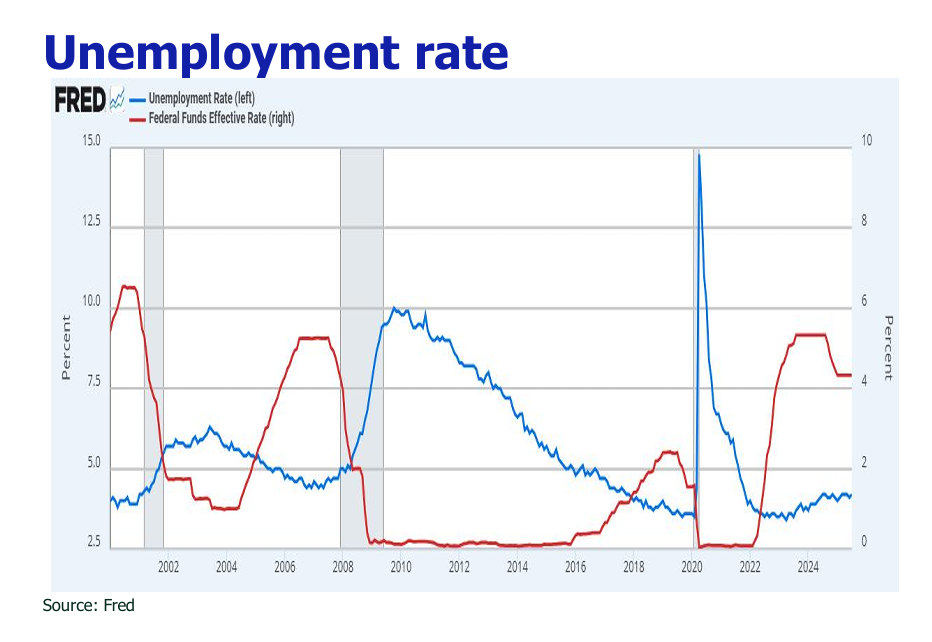
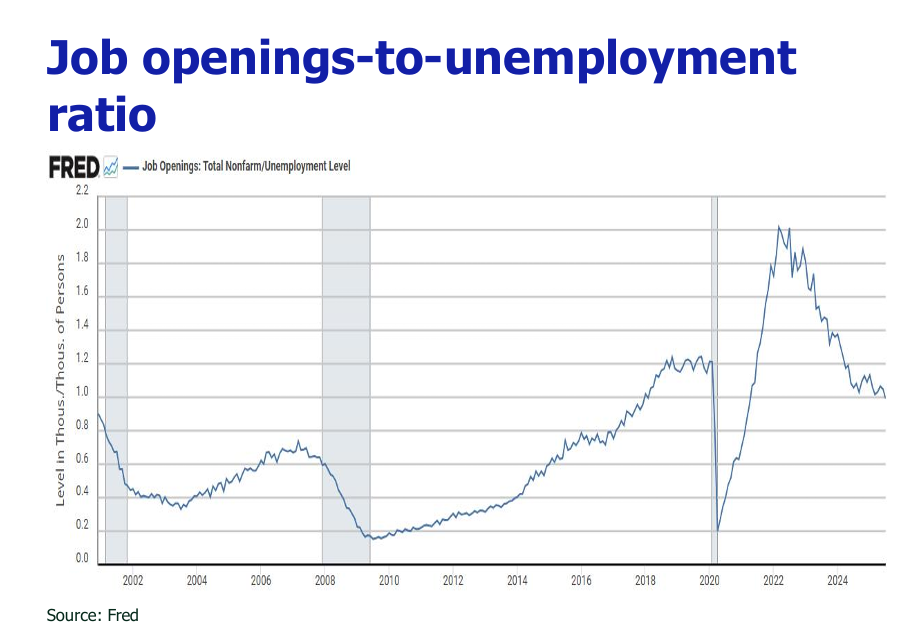
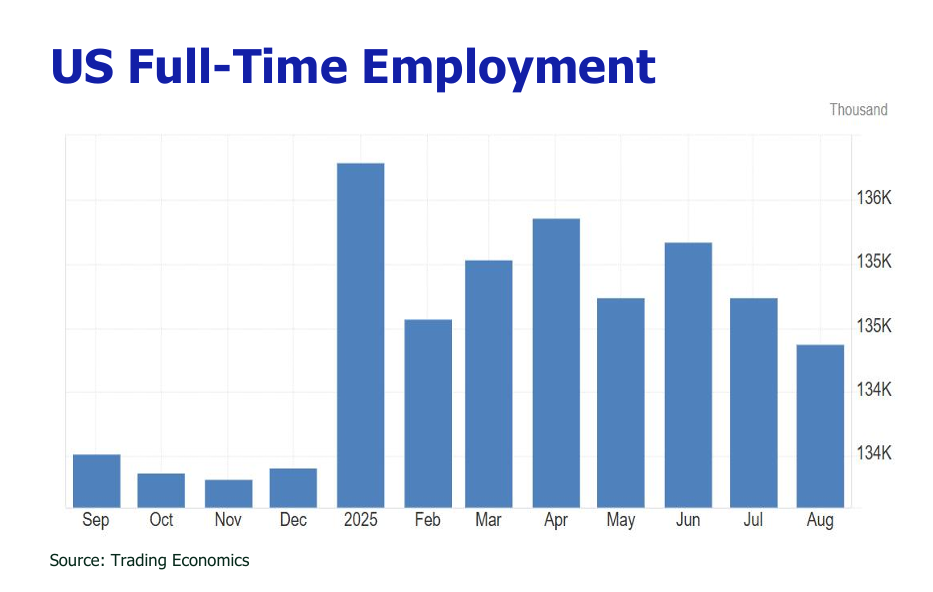
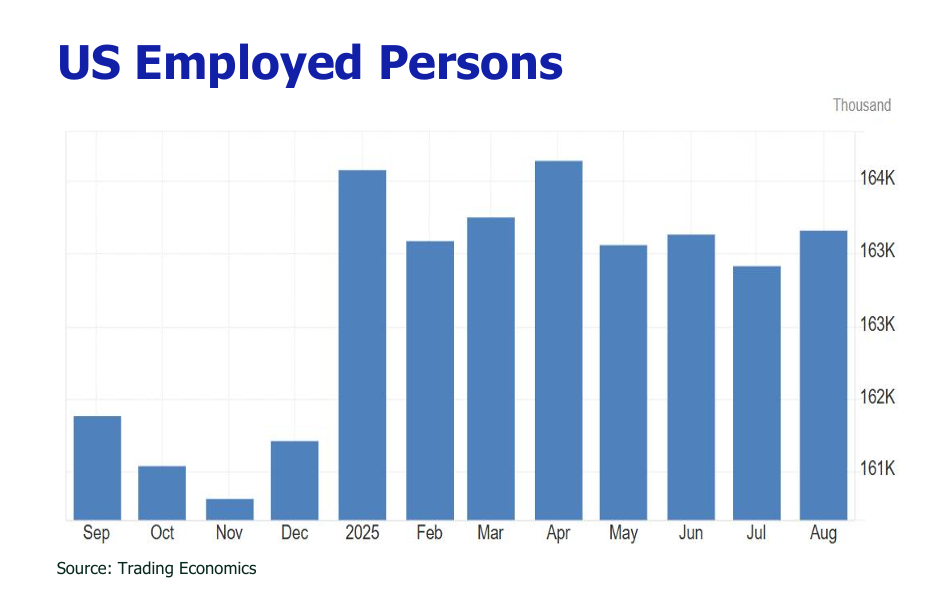
Beyond the First Cut: Mapping the Path for Fed Policy and Asset Prices in 2025
Austin Or, CFA
Highlights
August’s paltry 22,000 job growth and upward-trending unemployment rate to 4.3% signify a pronounced deceleration, exacerbated by whopping downward benchmark revisions and an ominous shift from full-time to part-time employment.
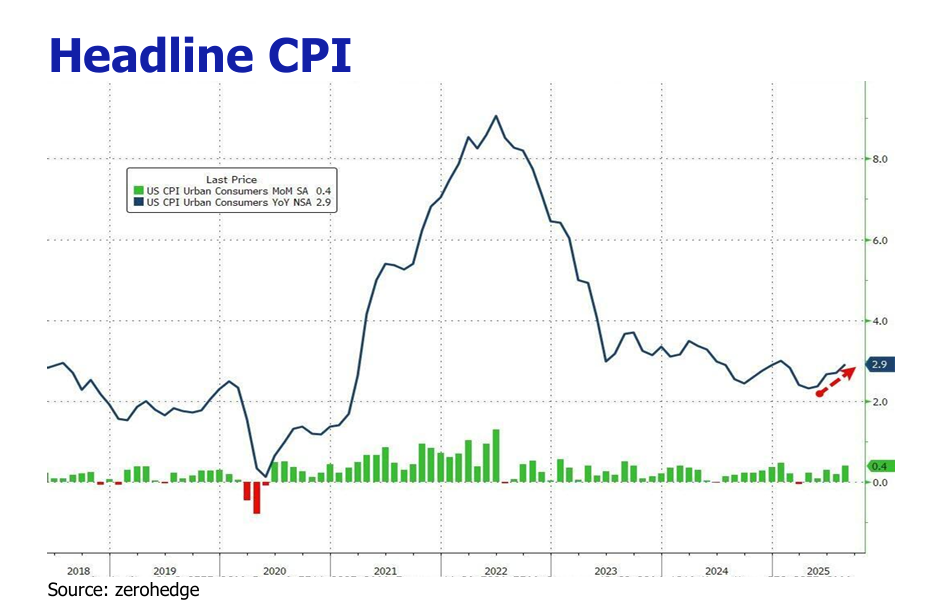
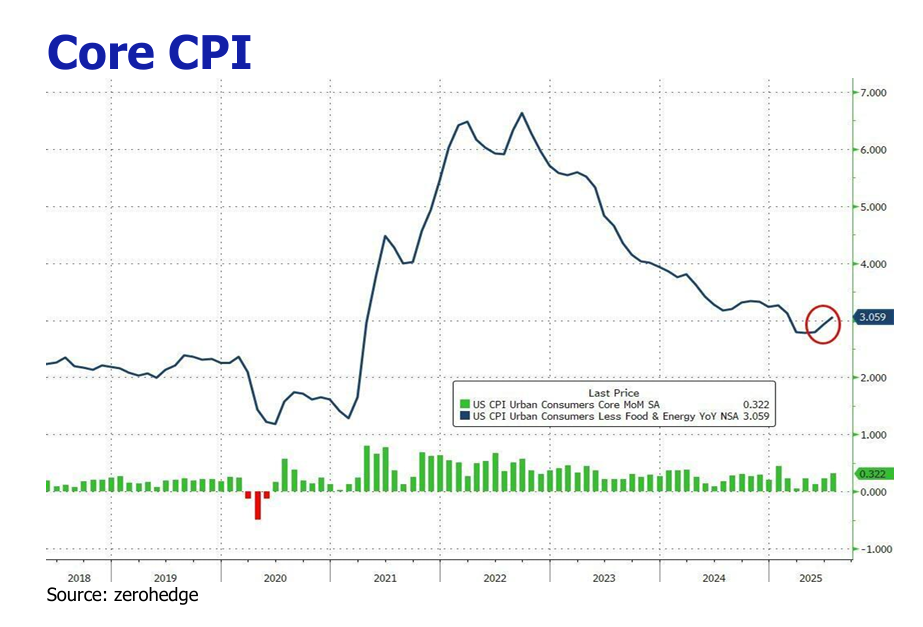
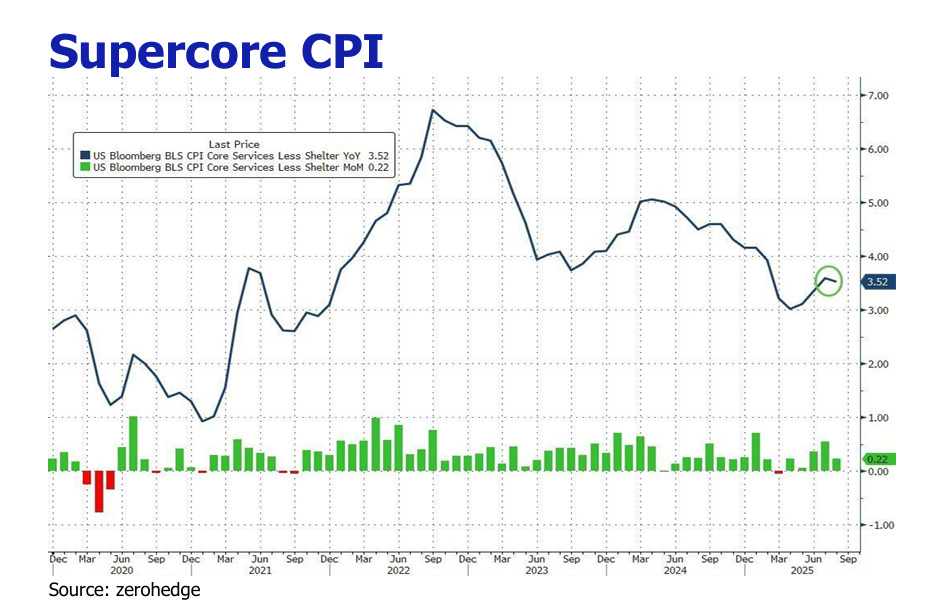
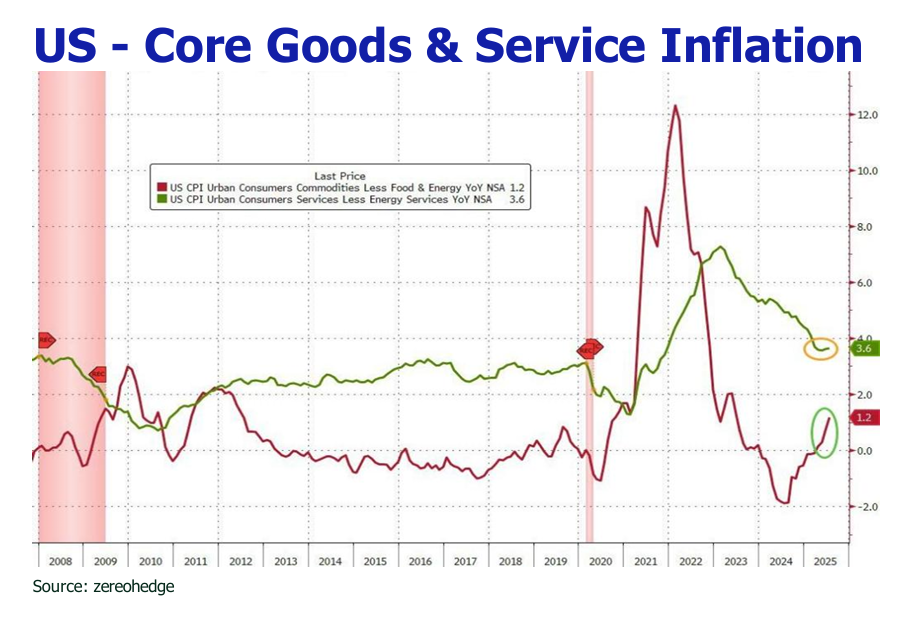
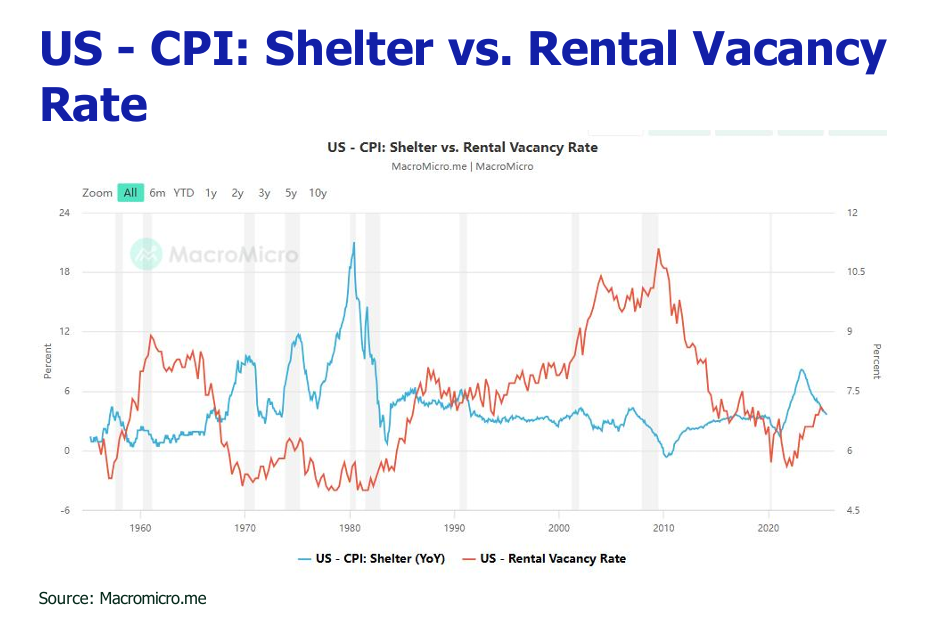
The acceleration in headline CPI with 0.2% YoY and MoM upticks compared to July, underscores the entrenchment of inflationary pressures, with the pronounced passthrough of tariffs into core goods prices signaling an incipient broadening of price gains beyond shelter and food.
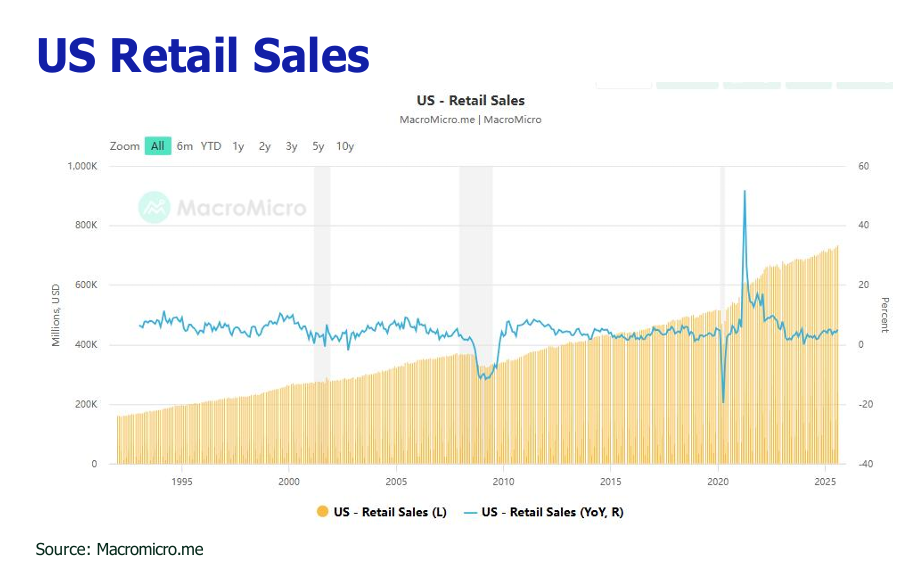
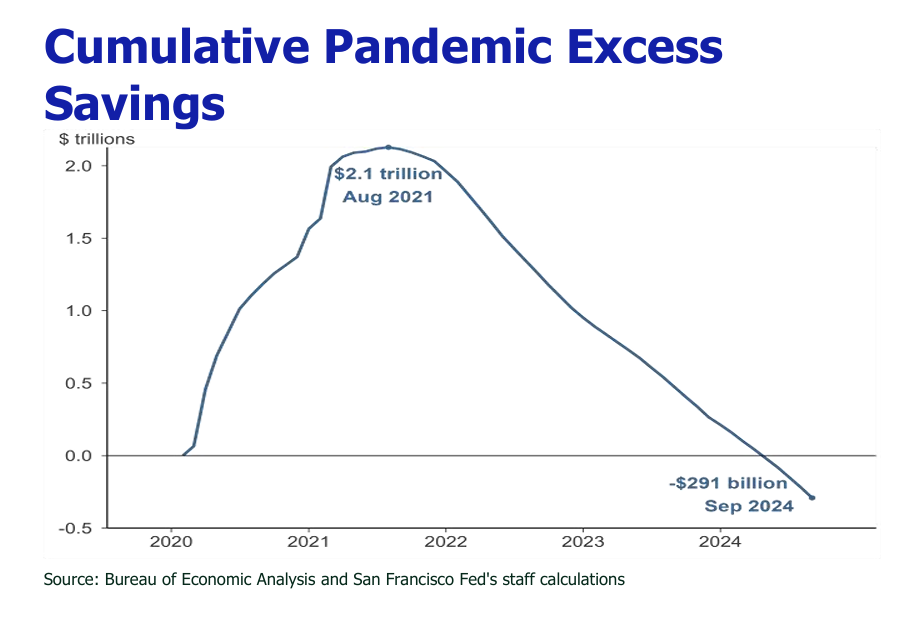
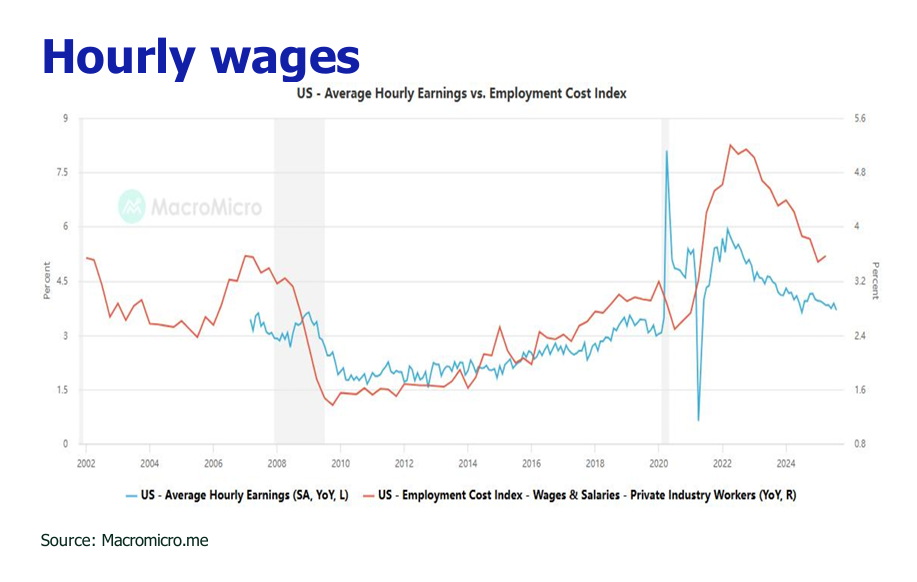
Robust retail sales stay afloat by sustained wage growth and robust equity markets, countervailing headwinds from a softening labor market and tariff-induced inflation.
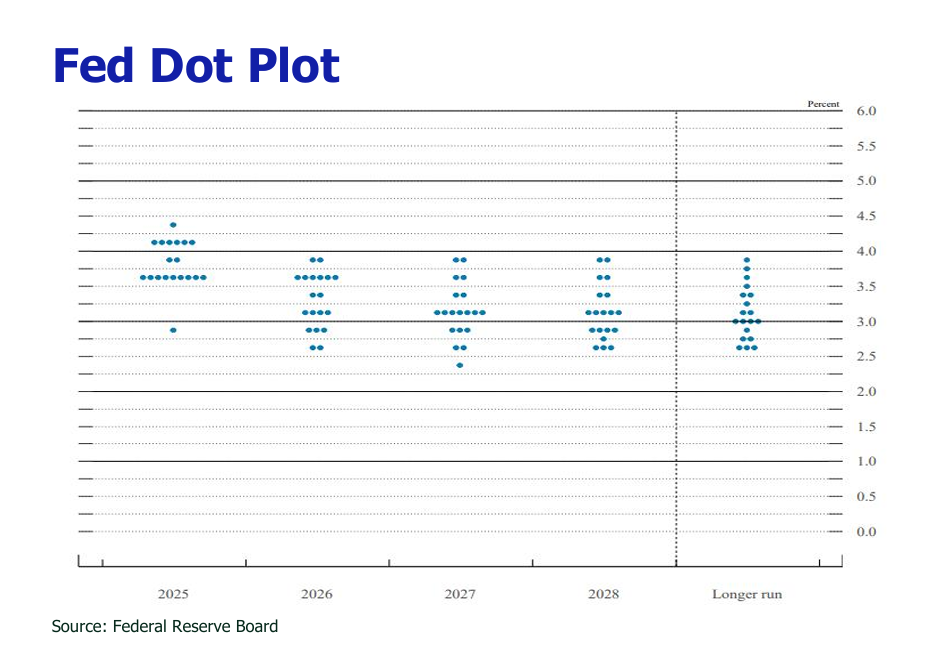
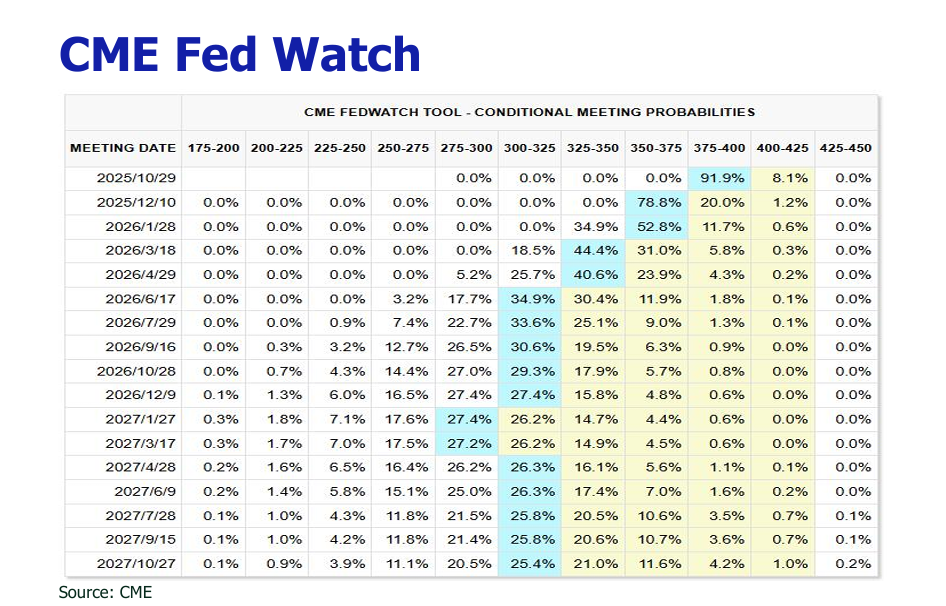
Three or two additional rate cuts are contingent on the wrestling between deteriorating labor metrics and persistent inflation.
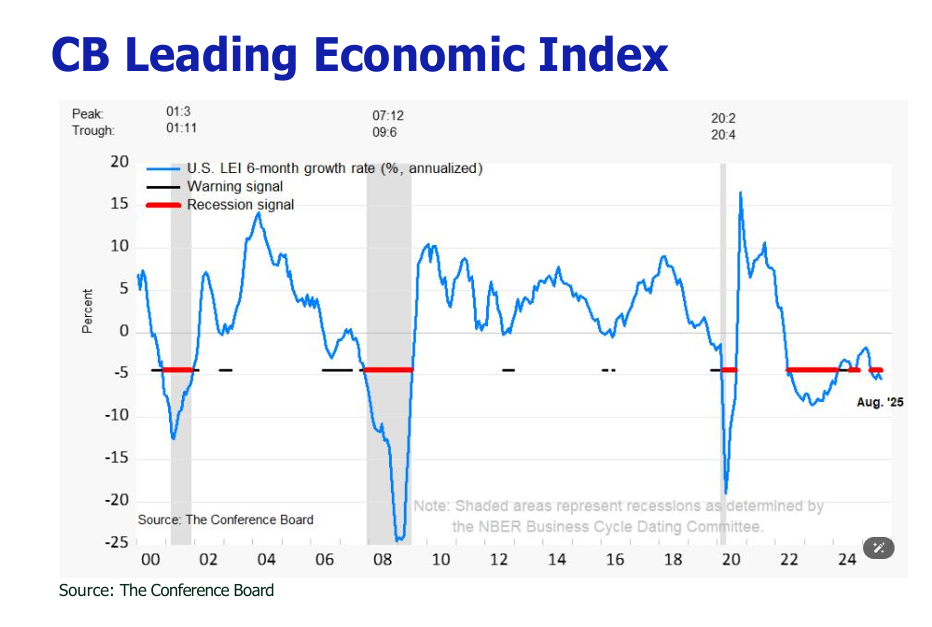
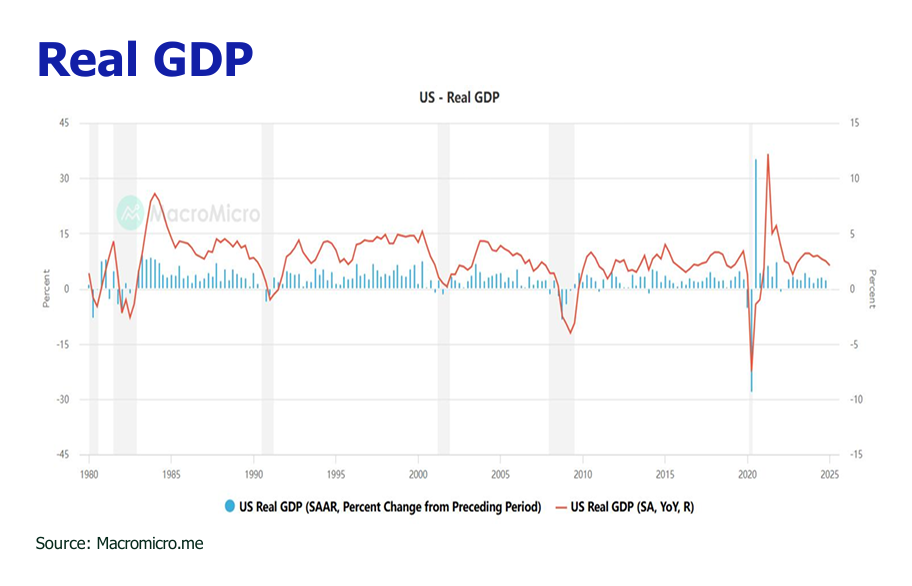
Buoyant PMI data and strong Q2 GDP growth bolster the narrative of a non-recessionary expansion.
Rate reductions are bound to undermine the USD (to 95), elevate the EUR (to 1.2), and bolster gold (targeting $4,000/oz by mid-2026) and cryptocurrencies (BTC to $124,000-$210,000 by year-end).
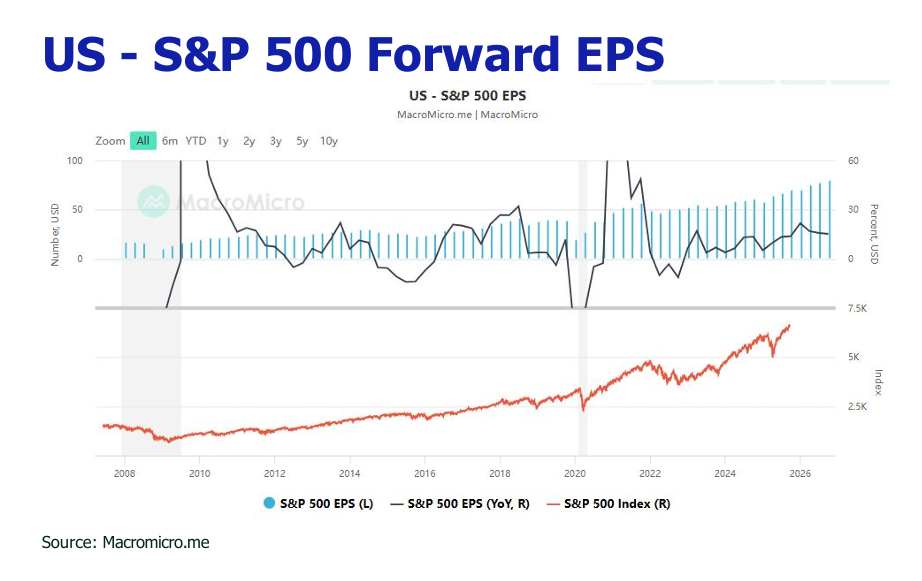
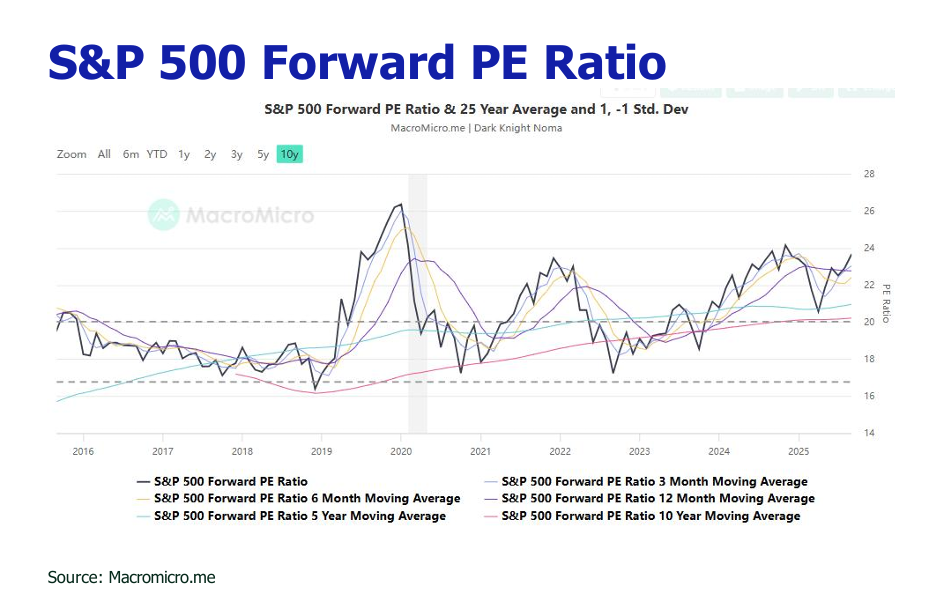
Historical precedent suggests that “insurance” rate cuts during non-recessionary periods have presaged significant equity appreciation, with the S&P 500 aiming for 6,800-7,100 by end-2025 and 7,000-7,500 by end-2026.
The HSI gained 3.4% in August, carving out an on-ramp to 28,000 in 2025 and 30,000 in 2026, propelled by US ongoing monetary easing, China’s AI progression and U.S.-China tariff truce optimism.
Job Data Sputters
Nonfarm payroll employment grew by a mere 22,000 jobs in August 2025, routing from July’s revised +79,000. The unemployment rate edged up to 4.3% from 4.2%, reaching its highest level since October 2021. Job gains were limited to a few sectors, led by health care (+31,000) and social assistance (+16,000). Most industries, including construction, retail, transportation/warehousing, information, finance, professional/business services, leisure/hospitality, and other services, showed stagnant hiring. Job losses were notable in the federal government (-15,000), manufacturing (-12,000), wholesale trade (-12,000), and mining/energy (-6,000). Preliminary benchmark revisions for April 2024 to March 2025 slashed payroll estimates by 911,000 jobs, or roughly-76,000 per month. Combined with August’s revisions, the average monthly job growth over the past three months was a paltry 29,000. Nonfarm payrolls have now grwn by less than 100,000 for four consecutive months, the weakest streak since the pandemic. Full-time employment plummeted by 357,000 in August, the second straight month of significant declines. Meanwhile, part-time jobs surged by 597,000, the largest increase since February 2025, highlighting a shift toward less stable employment.
Tariff Pressure Looms Larger On Inflation
The headline Consumer Price Index (CPI) increased by 2.9% YoY and 0.4% MoM in August 2025, accelerating from July’s 2.7% YoY and 0.2% MoM. The uptick was driven primarily by shelter costs (+0.4% MoM), food prices (+0.5% MoM), and growing passthrough effects from import tariffs. Core CPI, excluding volatile food and energy, rose 0.3% MoM and 3.1% YoY, steady with July. Tariff-driven inflation became more evident in August, with significant price increases in tariff-sensitive categories. Core goods like apparel (+1.1% MoM), electronics (+0.6% MoM), and household furnishings (+0.8% MoM) saw sharp rises, largely due to tariffs on imports from China and Vietnam. Grocery prices jumped, with bananas (+4.9% since April), coffee (+26% YoY), and beef (+14% YoY) reflecting tariffs on Latin American and Asian imports.
Retail Continues To Beat Tariff
August retail sales posted 0.6% MoM, matching the 0.6% increase in July and bucking the softening labor market and tariff-induced price pressures. Core retail sales, which exclude volatile components such as automobile dealers, gasoline stations, and restaurants, increased by 0.7% MoM, accelerating from the +0.4% growth in July, signaling robust underlying demand. Seasonal back-to-school spending boosted apparel and electronics, while a modest import price rise (+0.3% MoM) and steady wage growth (+0.3% MoM) supported consumer purchasing power. Strong equity markets further buoyed spending among higher-income households, sustaining consumption momentum.
PMI And Q2 GDP Exude Fortitude In The US Economy
The headline Composite PMI Output Index rose to 55.4 from 55.1 in July, indicating the strongest overall private sector expansion in three months and signaling annualized GDP growth of around 2.5% for Q3. Manufacturing PMI rallied sharply into expansion territory to 53.0 (July 49.8). Robust domestic restocking drove the rebound, countering tariff-related export headwinds. Output and backlogs reached their highest levels since mid-2022, while new orders hit a peak not seen since February 2024. Services PMI eased from July’s 31-month high to 54.5 (July 55.7) but still the second-strongest reading of 2025. New business rose solidly (55.1), supported by domestic demand. Services’ resilience (80% of GDP) aligns with August retail sales (+0.6% MoM), bolstering soft-landing hopes. The stronger-than-expected GDP data provides additional evidence that the economy remains on a solid footing. The U.S. economy grew at a revised annualized rate of 3.8% in Q2 2025, recovering from a Q1 decline influenced by tariff fallout.
Prediction
1.The Fed’s Path: Two to Three More Cuts Likely.
The Federal Reserve initiated its easing cycle with a 25 basis point (bps) cut at its September meeting, setting the federal funds target range at 4.00%-4.25%. Market consensus now strongly anticipates two additional preemptive cuts in October and December (76% probability), versus a lower probability of only one cut (20%).
The ultimate trajectory remains data-dependent. We believe:
Accelerated Cuts (50 bps): Could be triggered by a pronounced labor market slowdown, for instance, if payrolls fall below 50,000.
Accelerated Cuts (50 bps): Would likely occur if a sharp, tariff-driven surge in inflation materializes.
2.Rate cut Inflicts USD Weakness And Fuels Gains In EUR, Gold, and Risk Assets.
The rate cuts are poised to narrow interest rate differentials, exerting downward pressure on the US Dollar (USD) while boosting the Euro (EUR) and non-yielding assets like Gold. Concurrently, easier global liquidity and lower borrowing costs should stimulate risk-on assets, including equities and cryptocurrencies.
US Dollar (DXY): Following the September cut to 96.64, we see potential for a further decline to 95 (1% to-2%) if additional cuts proceed.
Euro (EUR): Could appreciate toward 1.20 from its current level near 1.18.This view is reinforced by the ECB’s signaled pause, which may fuel demand for EUR as a hedge against USD weakness.
Gold: Positioned to perform well in a lower-rate, elevated-inflation environment. Historically, Gold has never declined during an easing cycle with inflation above 2% over the past 25 years, posting gains of 26-39% within 24 months of the first cut in cycles like 2019, 2007, and 2000. Since the September 2024 cut, Gold is already up 48%, potentially amplified by growing distrust in the USD and robust central bank demand—a World Gold Council survey indicates 95% of central banks expect to increase gold reserves. Major banks like Goldman Sachs and JP Morgan project a target of $4,000/oz by mid-2026, supported by persistent inflation and demise of US dollar.
Cryptocurrencies: Bitcoin, which surged 690% in the 24 months following the first cut in 2019, has already gained 97% since September 2024. Analysts project targets of $124,000-$210,000 by year-end if two more cuts occur.
US equities: Despite headwinds from the labor market and tariffs, the U.S. economy is underpinned by robust consumer spending, tax cuts, and government expenditure. Full-year 2025 GDP forecasts range from 1.5% to 2.6%, indicating a slowdown but avoiding contraction.Historically, during “insurance” rate cuts in non-recession periods (1995, 1998, 2019), the S&P 500 rose 20-30% in the subsequent 24 months. To date, the index has gained 19% since the cycle began. Driven by dovish policy and AI optimism, Wall Street targets for the S&P 500 are 6,800-7,100 by end-2025 (2-6% upside) and 7,000-7,500 by end-2026 (5-13% upside).
China equities: The Hang Seng Index (HSI) has demonstrated strong performance, reaching ~26,300 by September—a 29-30% year-to-date gain and a 45-56% increase over 12 months. Catalysts such as China’s AI expansion, an extended tariff truce with the U.S., rising southbound inflows, and supportive U.S. rate cuts could drive a steady PE expansion from 15x to 17x. This supports a potential HSI rise toward 28,000 in 2025 and 30,000 in 2026.
Disclaimer
All information used in the publication of this report has been compiled from publicly available sources that are believed to be reliable, however we do not guarantee the accuracy or completeness of this report and have not sought for this information to be independently verified. Forward-looking information or statements in this report contain information that is based on assumptions, forecasts of future results, estimates of amounts not yet determinable, and therefore involve known and unknown risks, uncertainties and other factors which may cause the actual results to be materially different from current expectations.
We shall not be liable for any direct, indirect or consequential losses, loss of profits, damages, costs or expenses incurred or suffered by you arising out or in connection with the access to, use of or reliance on any information contained on this note.