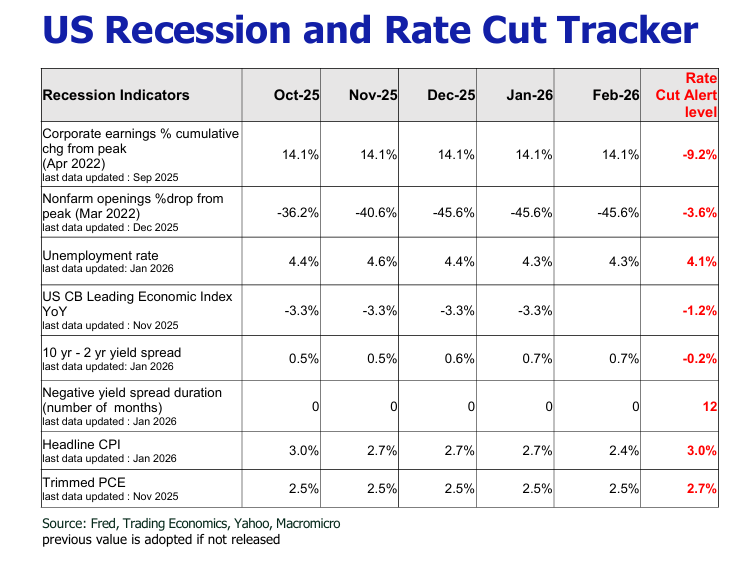
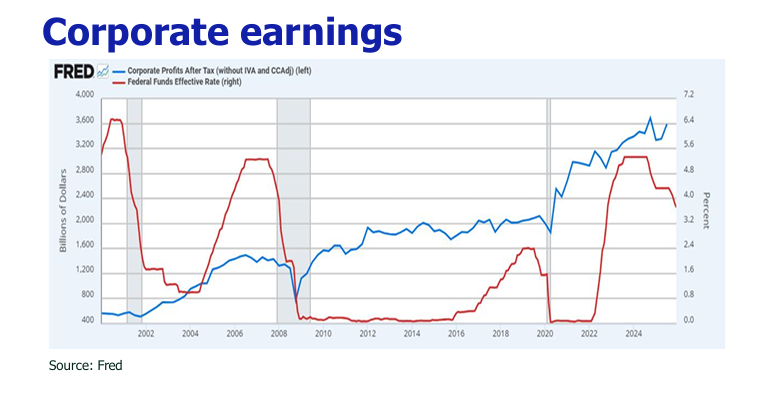
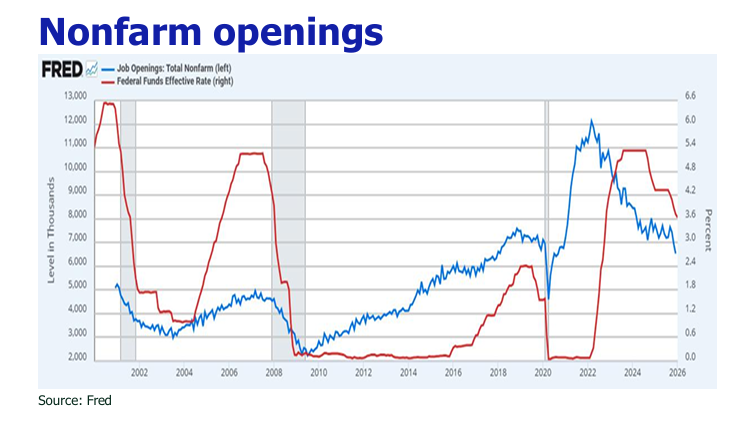
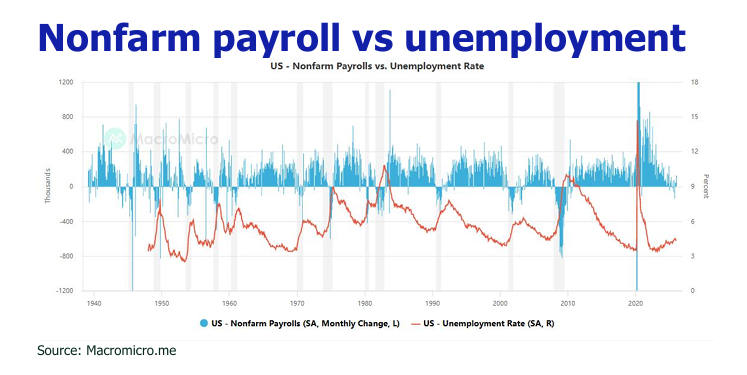
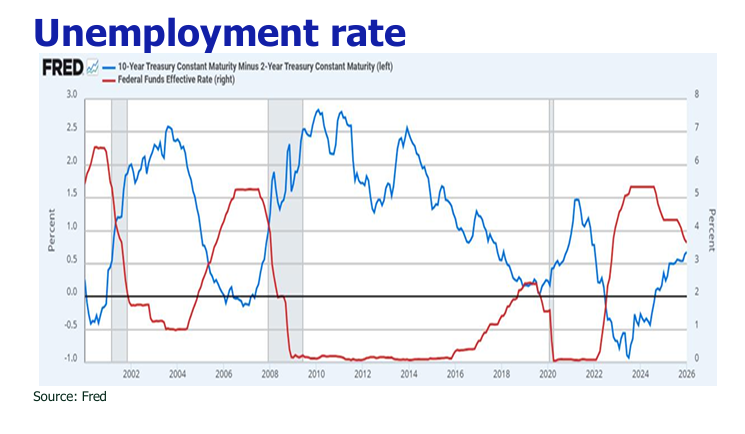
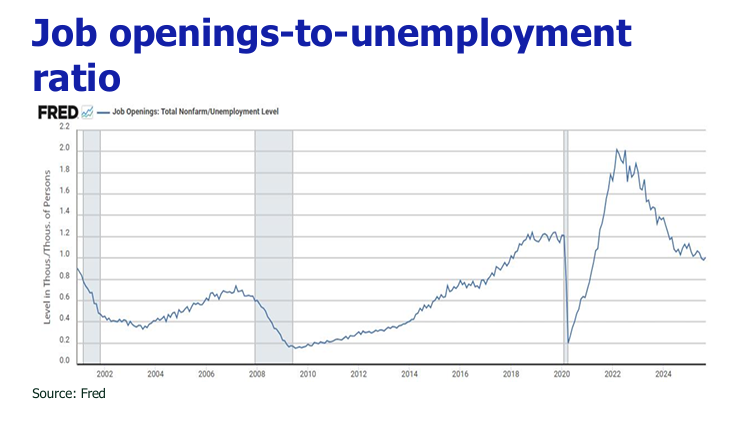
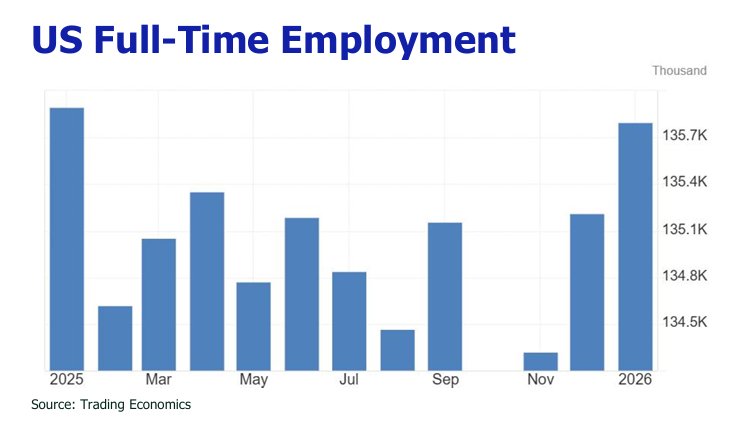
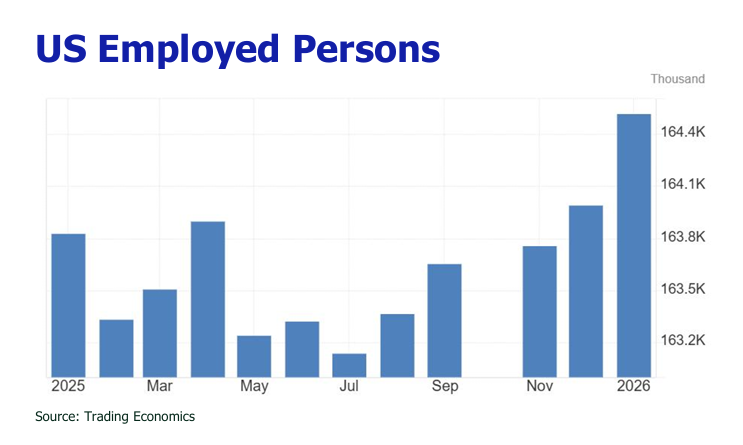
Longer rate hold, AI disruption fear, Iran tension and tariff invalidation stir up the market
Austin Or, CFA
Highlights
January NFP rebounded to +130,000, improving on Dec’s revised +48,000, with unemployment dipping to 4.3%, yet strength is contested due to massive prior downward revisions.
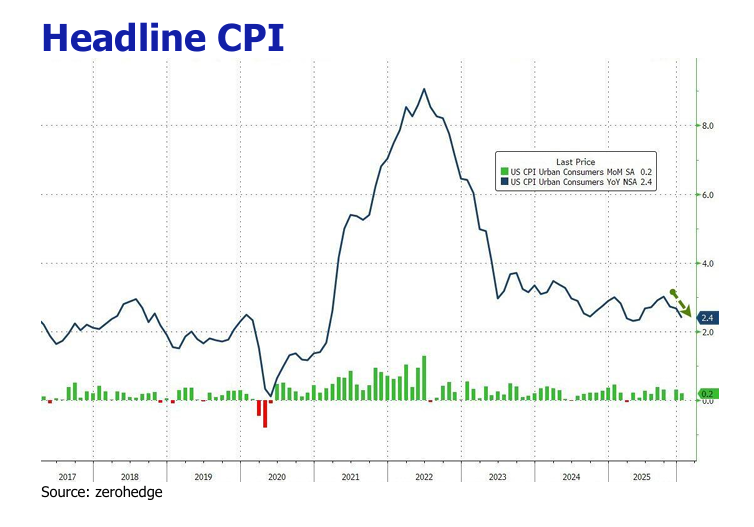
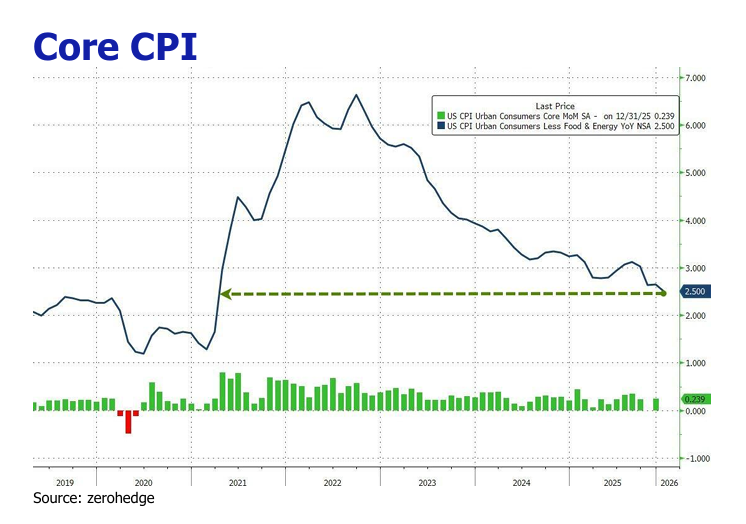
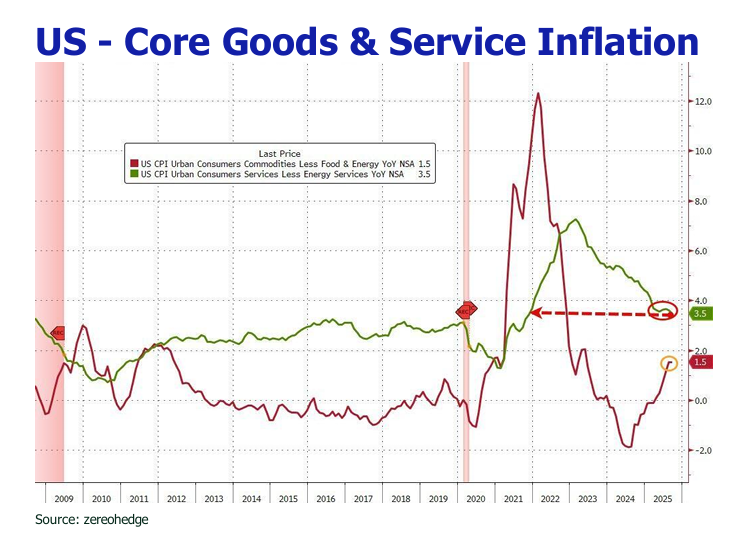
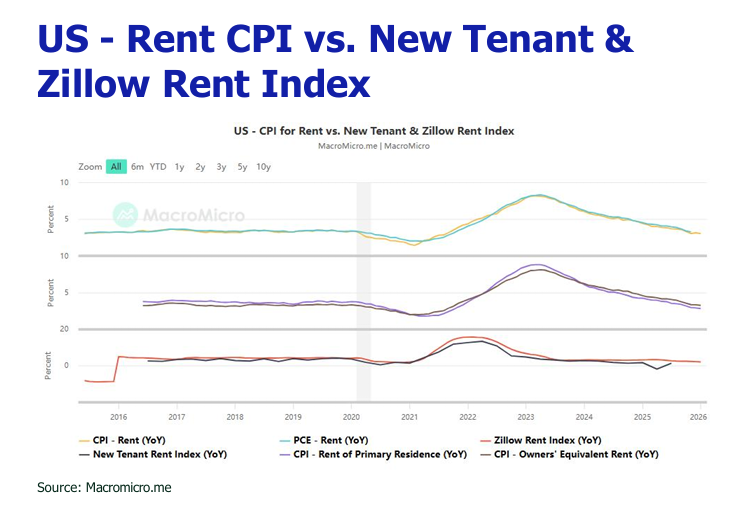
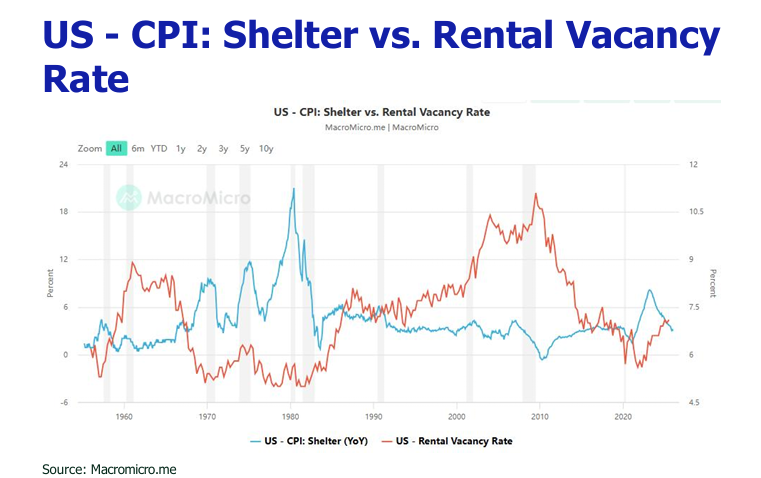
Headline CPI cooled to 2.4% YoY and core CPI to 2.5% YoY, with broad-based relief across food, energy, shelter, and used cars.
The Greenland acquisition hiccup has ignited a conflict that menaces U.S.-EU trade with the prospect of severe tariffs.
Oil prices hit six-month highs (Brent ~$71.70, WTI ~$66.50) as President Trump signals an imminent strike on Iran’s nuclear program.
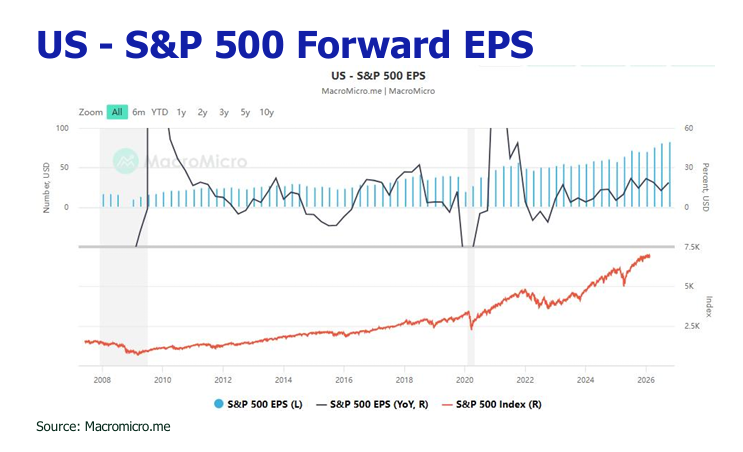
Investors sold “AI losers” vulnerable to disruption and worried about hyperscalers’ $740 billion capital expenditure in 2026 which could turn Mag 7 free cash flow to zero or negative.
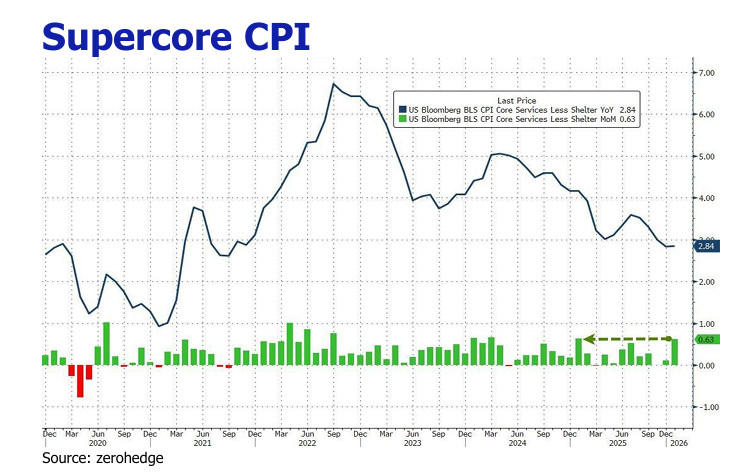
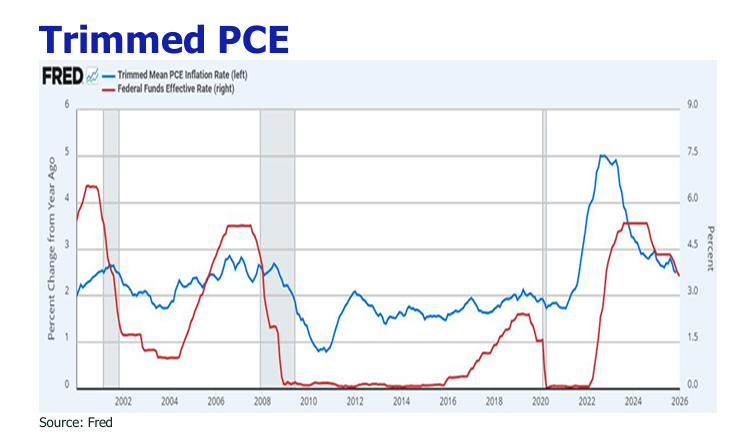
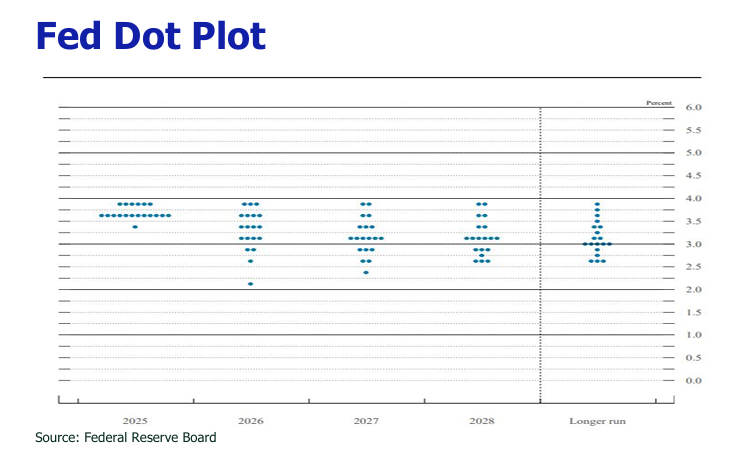
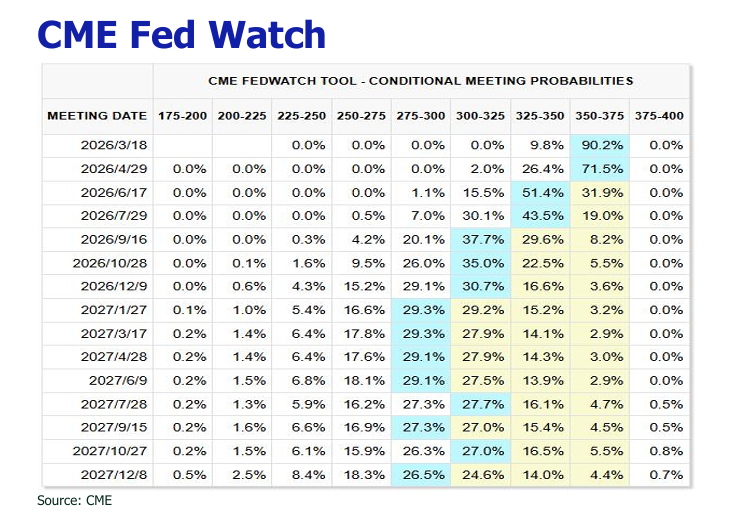
Entrenched inflation (tariff and service) and shaky labor strength have locked the Fed in hold mode.
Incoming Fed Chair Warsh’s ” lower rates + smaller balance sheet” policy combo, safe-haven buying ignited by geopolitical tensions with Iran and strong central bank accumulation momentum uphold the bull thesis for gold.
With Iran rejecting red lines and U.S. strikes on the horizon, Brent could test $80–85 or higher, echoing last year’s conflict spike.
By striking down broad tariffs, the Supreme Court has undermined tariff revenue and opened the door for refunds, delivering lower inflation and stronger growth while simultaneously straining the federal deficit.
The Hang Seng Index hovered between 26,000 and 27000, with daily turnover of HK$250-350 billion, experiencing a significant “AI stock heat,” characterized by a strong rally in AI application & model stocks, robotics companies, storage chip and semiconductor stocks.
Fanciful yet far-fetched January labor report
The January 2026 U.S. Nonfarm Payrolls (NFP) rebounded sharply to +130,000, a marked improvement over December’s anemic revised gain of +48,000, with the unemployment rate dipping modestly to 4.3% from 4.4%. Yet this ostensibly robust headline warrants considerable caution, given the pronounced downward revisions to prior data and the narrowly concentrated nature of the gains. Annual 2025 job growth was retroactively slashed from an initial ~584,000 to a mere +181,000—averaging just ~15,000 per month—and January payroll figures have been revised significantly lower in each of the past four years, underscoring a recurring pattern of initial overstatement.Virtually all of January’s strength emanated from healthcare and social assistance (collectively ~+124,000) and construction (+33,000), while virtually every other sector remained flat or contracted. This lopsided composition casts doubt on the breadth and durability of the pickup. Amid persistent uncertainty surrounding tariffs, immigration policy, government spending restraint, and the trajectory of monetary policy, businesses continue to exhibit pronounced caution, refraining from aggressive headcount expansion. Consequently, the apparent January turnaround appears more as a fleeting statistical anomaly than a credible inflection point, especially against such a depressed prior base.
January inflation offers headline relief, yet sticky services and tariff pressures cloud the outlook
January’s CPI data delivered the first clear signs of cooling in months: headline inflation eased to 2.4% YoY (from 2.7% in December), while core CPI moderated to 2.5% YoY (from 2.6%). The relief was broad-based — food prices rose only 0.2% after a 0.7% surge the prior month, energy tumbled 1.5% (led by gasoline’s steepest monthly drop in nearly a year), shelter costs slowed to +0.2% (from +0.4%), and used-car and truck prices plunged 1.8%, the largest decline in two years. Yet beneath the surface, stubborn pressures remain. Services inflation excluding energy accelerated to +0.4% month-over-month (from +0.3%), propelled by a 6.5% jump in airline fares, while healthcare costs rose 0.3% with hospital services surging 0.9%. Tariff-sensitive categories continued to show pass-through effects: apparel and household furnishings each gained 0.3%, laundry equipment and “other appliances” soared 2.6%, overall appliances climbed 1.3%, computers jumped 3.1%, floor coverings 3.2%, home furniture 1.0%, boys’ apparel 2.4%, watches 2.9%, and video/audio equipment 2.2%. Core goods prices ex-autos rose 0.4% in the month, lifting their annual rate to 1.6% — the highest in more than two years. This underlying firmness, even after stripping out volatile offsets, underscores that tariff and service inflation are far from vanquished.
Oil surges on looming U.S. military strike against Iran
Adding fresh fuel to the fire, oil prices have rocketed to six-month highs — Brent at ~$71.70 and WTI at ~$66.50 — as President Trump signals an imminent strike on Iran’s nuclear program. With U.S. carrier groups, bombers, and over 150 cargo planes now positioned in the region, traders have layered on a $4–6 geopolitical risk premium amid fears of disruption through the Strait of Hormuz, which handles 20% of global oil flows.
Risk-off sentiment sweeps U.S. equities
The combustible mix of geopolitical tension and structural concerns triggered a sharp selloff in U.S. stocks, most visibly on February 19. Investors fled “AI losers” vulnerable to technological disruption — hammering enterprise software, logistics, wealth managers, insurance advisors, and real estate agents—while fretting over hyperscalers’ projected $740 billion capital expenditure in 2026. Analysts warn this unprecedented spending spree could drive the Magnificent 7’s free cash flow to zero or negative, as AI returns may fail to match the outlays and accelerate market saturation, forcing an earlier investment pause. The pressure intensified when Blue Owl Capital restricted liquidity after selling $1.4 billion in loan assets, sparking broader fears for the $2 trillion+ private credit market and dragging down asset managers and financial stocks.
Overturn of sweeping tariff by The Supreme Court risk reduced tariff revenue and refund
The Supreme Court’s 6-3 ruling on February 20, 2026, struck down President Trump’s sweeping tariffs imposed under the International Emergency Economic Powers Act (IEEPA), declaring them illegal. In response, the Trump administration announced a new 15% global tariff based on Section 122 of the Trade Act of 1974, while also resorting to Section 301 (addressing unfair trade practices) and Section 232 (national security-based tariffs on specific goods like steel and aluminum) to backfill the void left by IEEPA.
However, each of these statutory tools carries significant structural weaknesses that undermine the administration’s goal of preserving tariff income at 2026 levels. Section 122 is legally capped at 15% and can only remain in effect for a maximum of 150 days (extendable once for another 150 days) unless Congress acts, creating immediate uncertainty and a ticking clock for the revenue stream. Section 301 requires lengthy, country-specific investigations that take 6 to 12 months, creating a “short-term vacuum” in revenue that cannot be quickly filled. Section 232, meanwhile, is limited to specific industries—primarily steel, aluminum, and automobiles—requires formal investigations by the Commerce Department, and cannot support the broad, global tariff coverage necessary to replicate the scale of the now-invalidated IEEPA program. Thus, while the administration may successfully collect significant duties for the next 150 days, the structural limitations of these replacement authorities make the long-term sustainability of tariff revenue highly uncertain.
Although the Supreme Court did not rule on whether the government must refund the approximately $170 billion in tariffs already collected under the illegal IEEPA program, its decision opens the door for importers to seek refunds through the U.S. Court of International Trade (CIT). However, the likelihood of an easy or quick payout is very low. The process will likely be a prolonged, document-intensive legal and administrative battle. The administration’s political desire to preserve tariff revenue, combined with President Trump’s own statements about tying refunds up in court for years, suggests the path forward will be greatly compromised.
Prediction
1. Fed keeps rates on hold in early 2026: bumpy inflation and resilient labor market leave no room for cuts.
January’s data delivered exactly the mixed signal the Fed was watching for: headline relief on inflation, but enough bumps and labor strength to keep the punchbowl firmly in place for now. As shelter and core services remained sticky, core goods (excluding volatiles) showed some underlying firmness when stripping out offsets like used-car price drops, reinforcing that tariff pressures aren’t fully masked yet. This underlying inflation entrenchment gives the Fed no urgency to cut rates while tariff and geopolitical risks (e.g., oil spike from Iran tensions) could push inflation bumps higher later in the year.Although 2025 annual revisions revealed much weaker job creation overall (+181k for the full year), January’s rebound signals the labor market has stabilized and remains strong enough that the Fed does not need to ease policy to support employment.
2.Bullish gold thesis strengthens: Warsh’s policy mix, geopolitics, and institutional demand create a perfect storm
In this environment, gold continues to shine. Incoming Fed Chair Kevin Warsh’s “lower rates + smaller balance sheet ” framework is being interpreted as structurally positive for the yellow metal. Faster rate cuts reduce the opportunity cost of holding non-yielding gold, while aggressive QT (more balance-sheet runoff, potential MBS sales) signals reduced liquidity abundance and erodes confidence in traditional paper assets — making gold’s zero-yield, no-counterparty-risk profile increasingly attractive. President Trump’s warning of attach on Iran in near term, backed by massive U.S. military deployment, has reignited safe-haven buying. The June 2025 “12-Day War” precedent shows gold can surge 5–10%+ on initial risk-off moves and sustain gains amid lingering uncertainty. Institutional momentum is equally compelling: central banks are on track to buy another 750–850 tonnes in 2026 (led by China and India), Western ETFs recorded massive inflows, and major institutions are lifting gold allocations to 5–20% of portfolios as a hedge against debt, currency, and policy risks. Consensus targets have been revised sharply higher — J.P. Morgan $6,300, Goldman Sachs $5,400, UBS $6,200 — with most banks now forecasting $5,000+ averages for the year.
3. Short-term oil surge risk remains elevated
With Iran rejecting U.S./Israeli red lines on zero enrichment, missile curbs, and proxy support, the probability of U.S. strikes as early as this weekend or early next week is very high. Should Iran retaliate against U.S. bases, Israel, or Gulf infrastructure, Brent could quickly test $80–85 or higher — echoing the brief $80–81 spike seen during last year’s conflict. While history suggests any spike may prove temporary absent sustained supply loss, the near-term risk of further upside in oil — and renewed volatility across markets — is materially elevated.
3. Disinflation shift, higher economic growth and fiscal headwind
Following the Supreme Court’s ruling, the invalidation of tariffs on approximately $500 billion to $700 billion in annual imports delivers a significant and timely disinflationary shock to the U.S. economy, effectively neutralizing a key source of upward pressure on core goods CPI that economists had expected to peak in the second quarter of 2026. By eliminating these broad-based duties, the decision provides a tangible boost across the supply chain—lowering input costs for manufacturers, retailers, and downstream industries such as autos, appliances, and construction—thereby improving profit margins, easing cost-of-living pressures for consumers, and removing a major drag on business investment that had been stifled by trade uncertainty. However, this relief comes with a substantial fiscal trade-off: the loss of an estimated $160 billion to $200 billion in annual tariff revenue sharply exacerbates the federal budget deficit, forcing the Treasury to increase borrowing to fill the gap, which in turn places upward pressure on long-term bond yields and could modestly crowd out private investment.
Disclaimer
All information used in the publication of this report has been compiled from publicly available sources that are believed to be reliable, however we do not guarantee the accuracy or completeness of this report and have not sought for this information to be independently verified. Forward-looking information or statements in this report contain information that is based on assumptions, forecasts of future results, estimates of amounts not yet determinable, and therefore involve known and unknown risks, uncertainties and other factors which may cause the actual results to be materially different from current expectations.
We shall not be liable for any direct, indirect or consequential losses, loss of profits, damages, costs or expenses incurred or suffered by you arising out or in connection with the access to, use of or reliance on any information contained on this note.