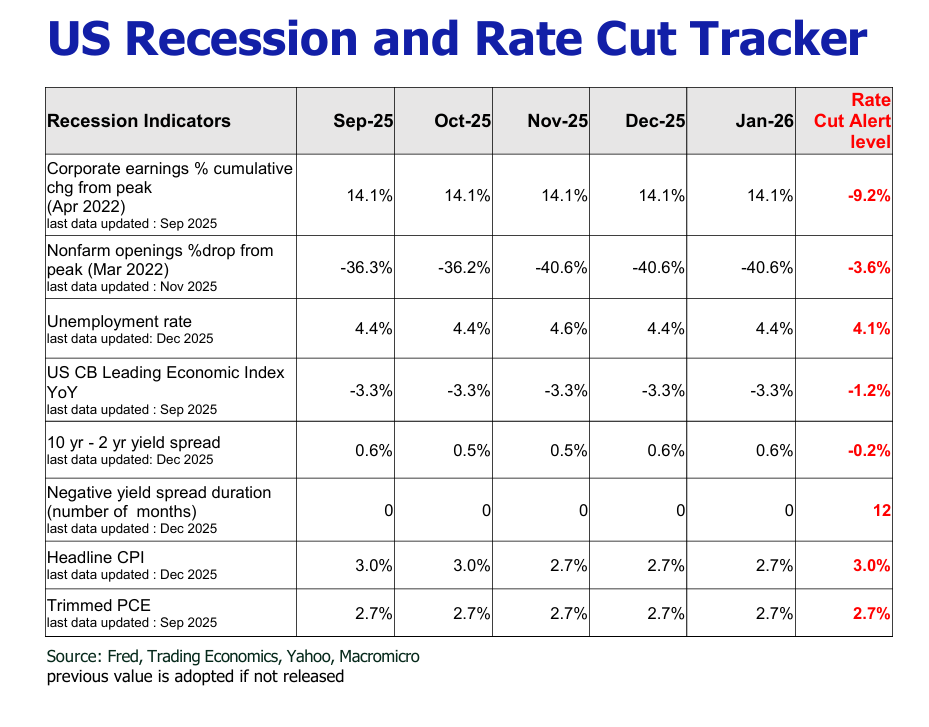
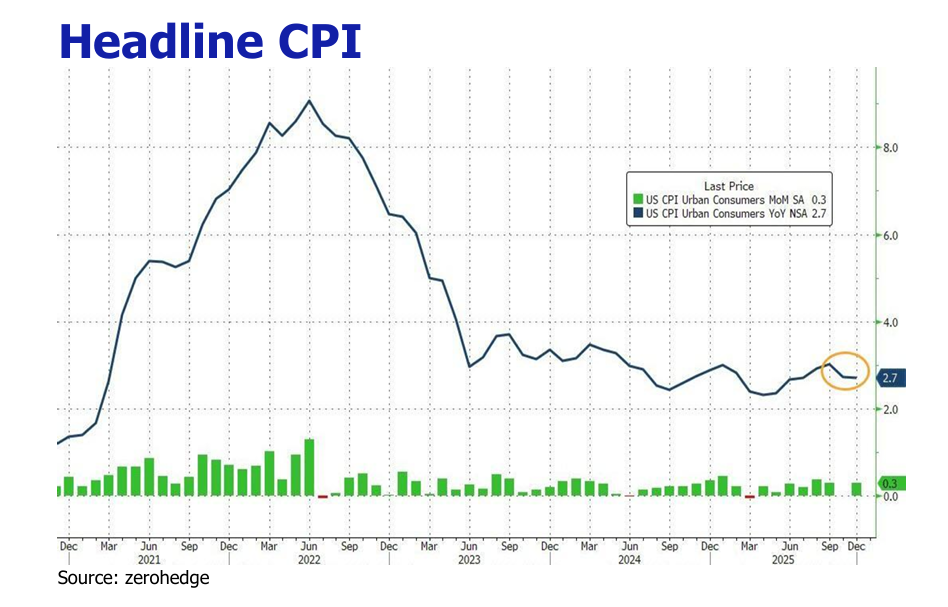
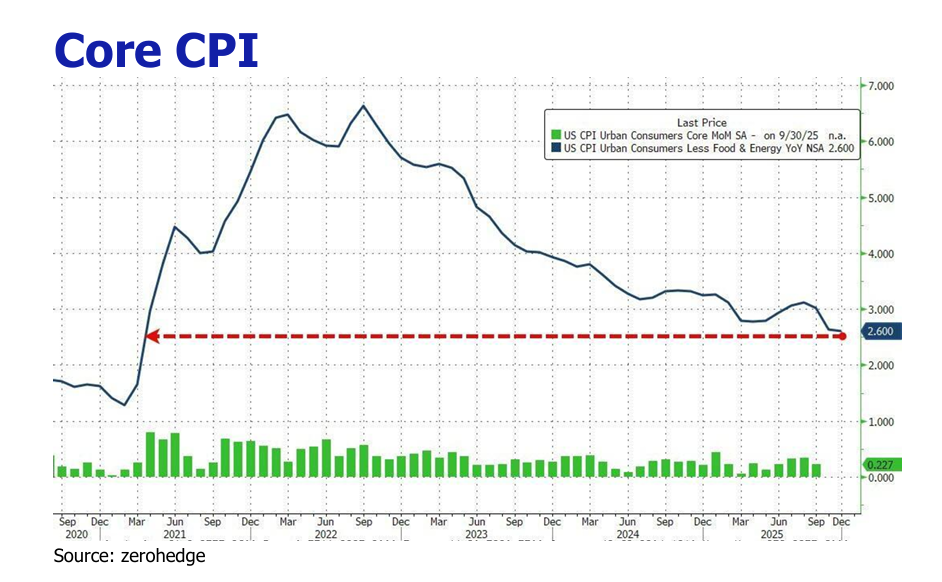
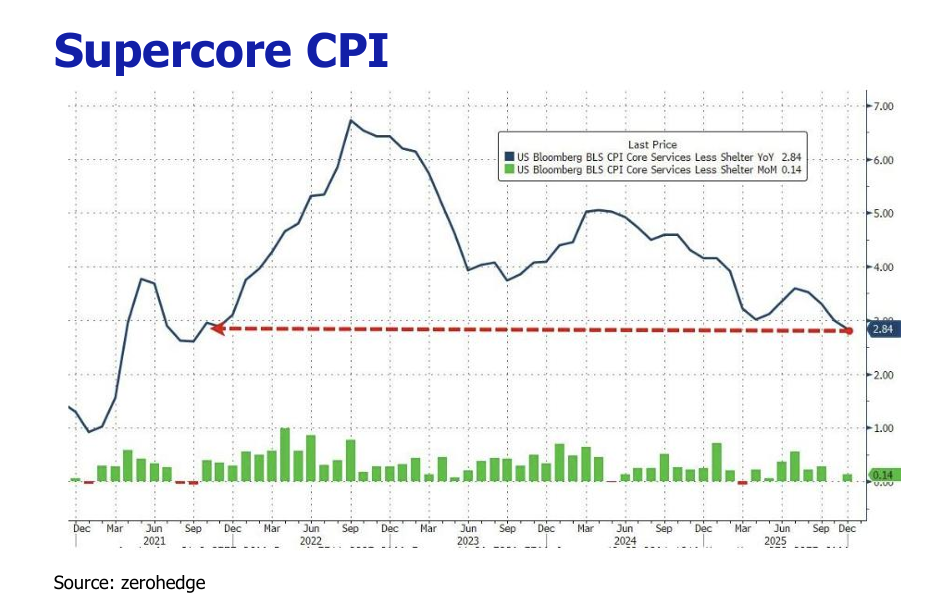
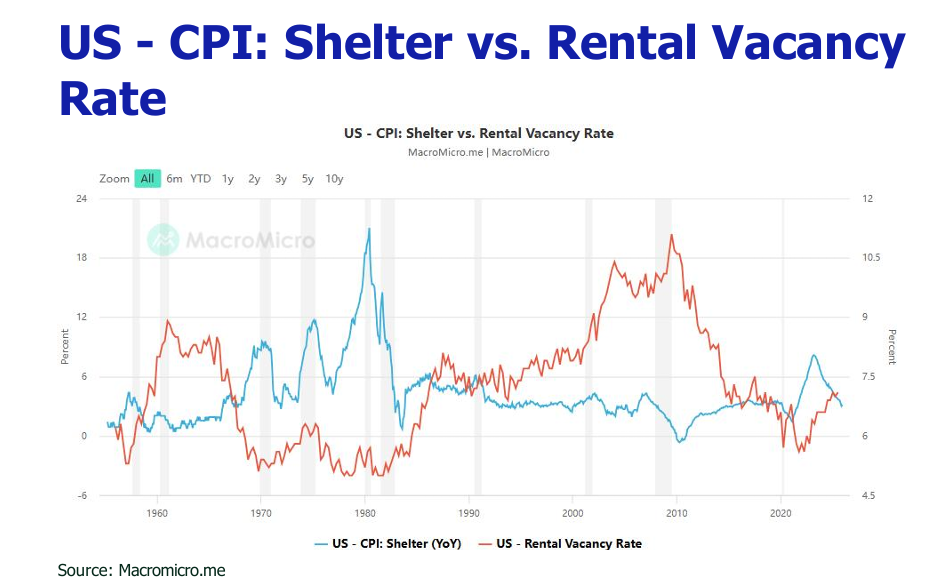
Crosscurrents of stasis: sticky inflation, a faltering labor market, and the looming shadow of tariffs

Austin Or, CFA

Highlights

US December CPI remained stagnant at 2.7% year-over-year as rising food and shelter costs offset falling energy prices, with core inflation holding steady at 2.6% despite mixed sectoral trends like holiday-driven airfare spikes and declining used vehicle prices.
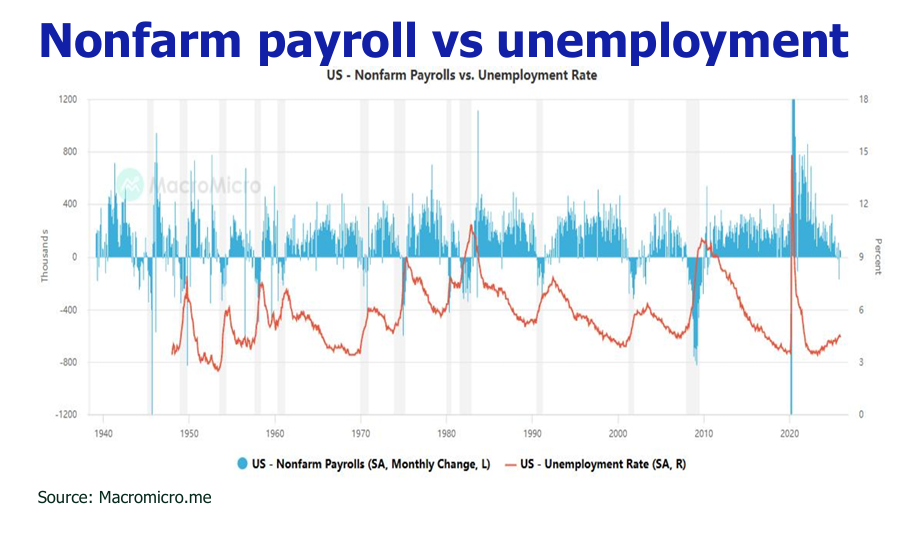
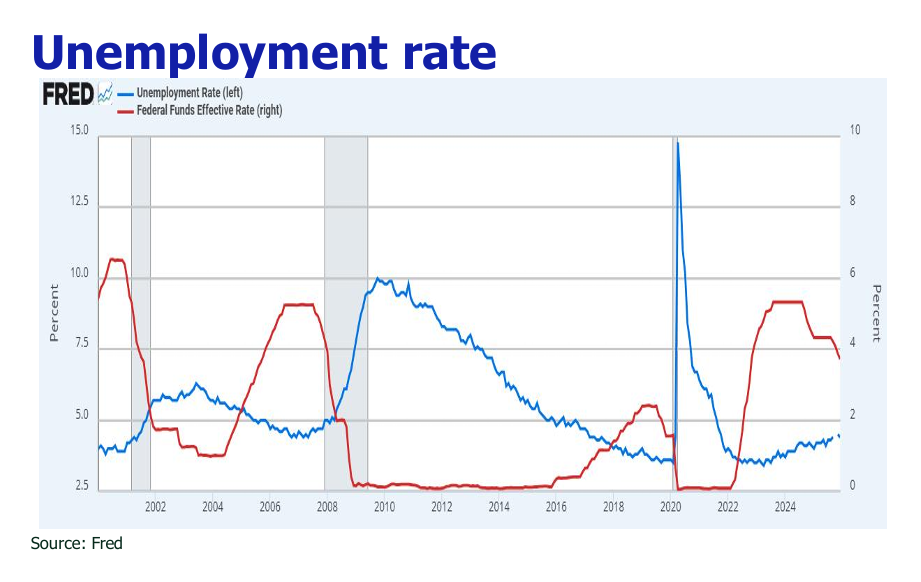
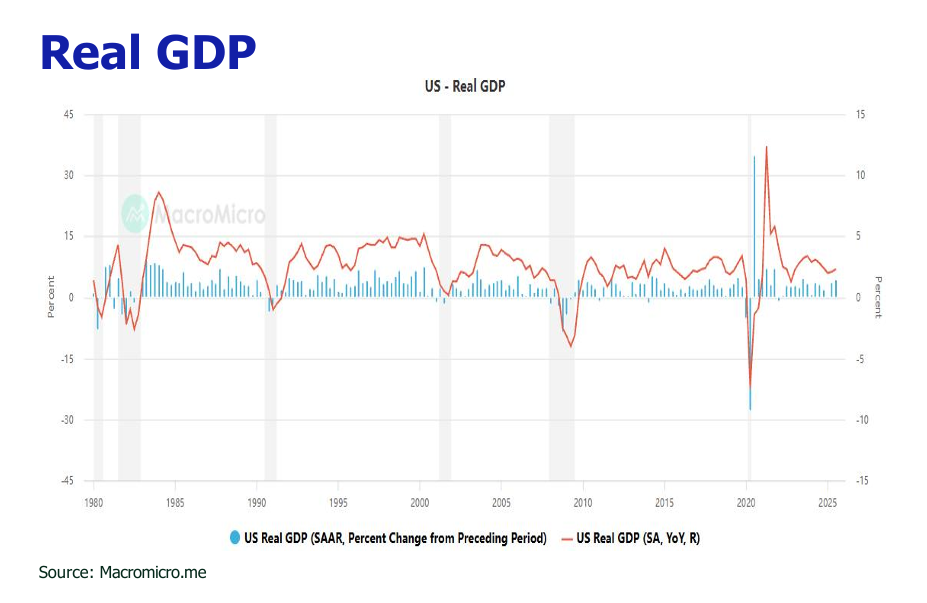
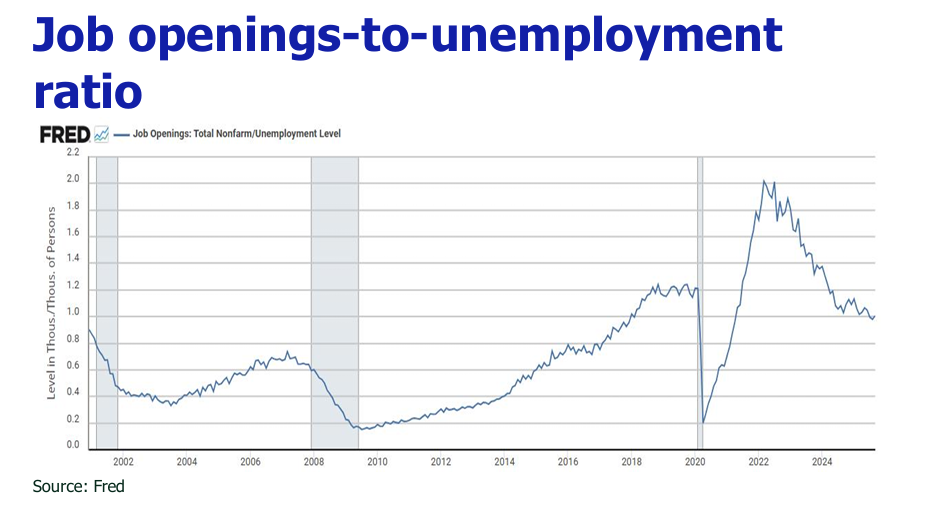
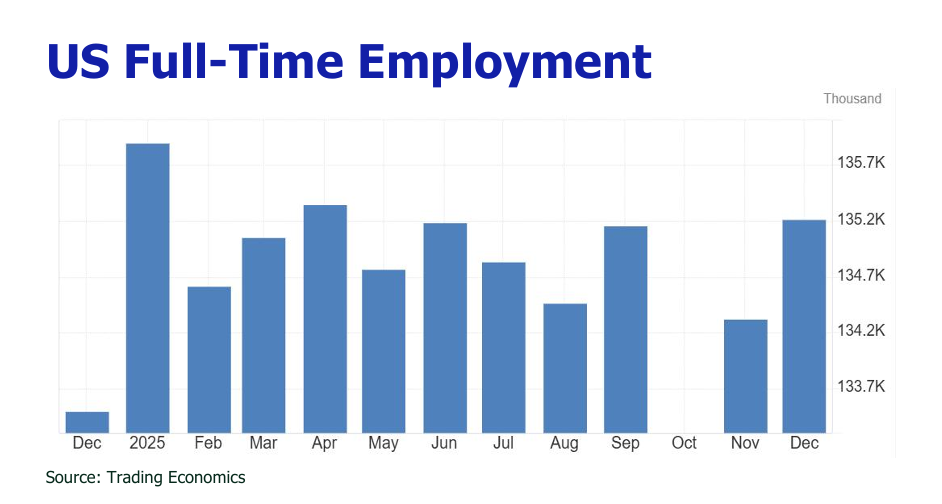
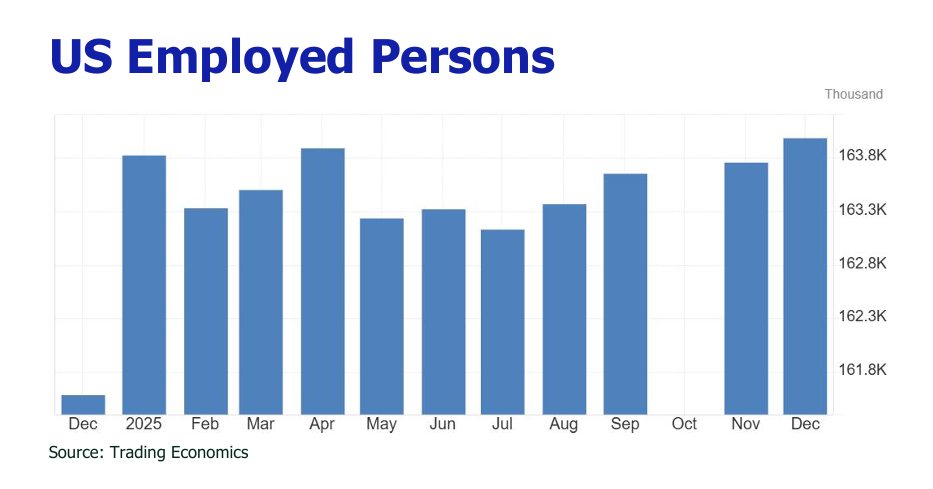
The US labor market exhibited mixed dynamics with the weakest annual job growth since 2020 (adding only 50,000 jobs in December), yet the unemployment rate dipped to 4.4% as service sectors added positions while manufacturing, construction, and retail cut jobs.

The Greenland acquisition hiccup has ignited a conflict that menaces U.S.-EU trade with the prospect of severe tariffs.

Oilprices in January 2026 experienced sharp but temporary volatility, briefly pushing Brent above $66/bbl due to geopolitical instability in Venezuela and Iran, before retreating to the mid-$50s and low-$60s as risks de-escalated and the market refocused on global oversupply.

Asurgein Japan’s government bond yields, driven by fiscal stimulus fears, briefly roiled global markets, lifting U.S. yields and pressuring stocks.
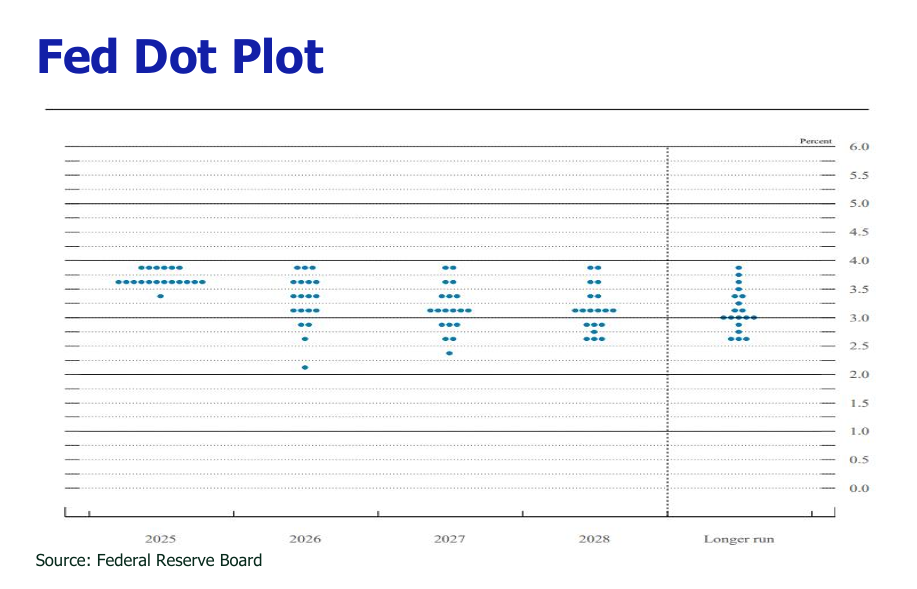
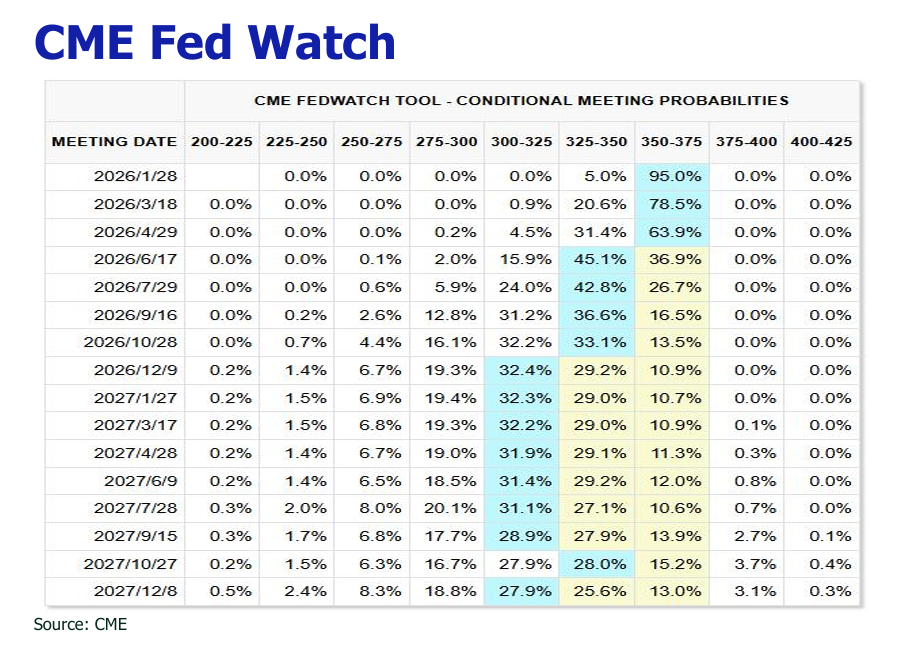
The Federal Reserve is expected to halt rate cuts in Q1 2026, prioritizing inflation control over labor market cooling, as it waits for the full impact of new tariffs to pass through to consumer prices and for clearer evidence of core inflation sustainably falling toward its 2% target.

The outlook for gold in 2026 remains strongly bullish, underpinned by persistent structural drivers including sustained central bank buying, low real yields, high geopolitical hedging demand, and substantial room for increased allocations in private and institutional portfolios.

The USD is expected to depreciate 4–8% in 2026, driven by anticipated Fed rate cuts that erode its yield advantage.

The Hang Seng Index topped out 26,000, with daily turnover surging to above HK$250 billion, driven by PBoC’s monetary easing (0.25% lending rate cut, further RRR and rate cuts signals), sustained southbound capital inflows through Stock Connect, and rate cut positive (Dec and more in 2026) from the U.S..

Persistent inflationary stasis

U.S. December CPI rose 2.7% year-over-year and 0.3% month-over-month, mirroring November’s figures. While food prices accelerated markedly to 3.1% YoY and 0.6% MoM, the inflationary impulse was mitigated by declining energy prices, which fell 2% YoY and 0.3% MoM. Core CPI remained
unchanged at 2.6% YoY and 0.2% MoM, underpinned by tempered core goods inflation (1.4% YoY, 0% MoM) and moderated core services inflation (3% YoY, 0.3% MoM). Tariff-sensitive categories such as apparel and furnishings registered gains exceeding 0.5% YoY, while shelter inflation crept higher to 3.6% YoY—bolstered by a seasonal surge in holiday lodging (2.9% YoY). Recreation services increased 1.8% YoY, and airfares jumped 5.2% YoY, largely attributable to holiday demand. These upward pressures were counterbalanced by deceleration in transportation (0.3% YoY), communication services (-1.5% YoY), and used vehicle prices (-1.6% YoY).

Mixed labor market dynamics: soft payrolls amid declining unemployment

The December nonfarm payroll report revealed a mere 50,000 increase, following a downwardly revised gain of 58,000 in November, with cumulative downward revisions over the prior two months totaling 76,000. For the entirety of 2025, nonfarm payrolls expanded by only 584,000—marking the weakest annual performance since the pandemic-induced contraction of 9.2 million in 2020. While government employment rose by 13,000, private-sector hiring decelerated sharply from 50,000 in November to 37,000 in December. Concurrently, the unemployment rate declined to 4.4% from 4.5%, as the number of unemployed persons fell by 278,000 and total employment increased by 232,000. Persistent policy headwinds have dampened business sentiment and constrained hiring, prompting firms to adopt a cautious posture focused on cost containment and operational flexibility amid an uncertain environment. Job creation remained concentrated within service sectors, which added 58,000 positions across education, healthcare, leisure, and hospitality. Conversely, retail employment contracted by 25,000 amid subdued seasonal hiring, while manufacturing and construction shed 8,000 and 11,000 jobs, respectively.

Greenland sovereignty dispute ignites fresh transatlantic tariff conflict

The Greenland sovereignty dispute remains unresolved as of January 23, 2026, despite President Trump’s recent signals suggesting a potential de-escalation of tariffs and military posturing toward the European Union. While Trump’s January 20 statement indicated a willingness to “temporarily suspend” the 10% tariffs (imposed February 1 and escalating to 25% by June) pending “productive talks” on Greenland’s acquisition, EU officials have dismissed this as insufficient, insisting on a full revocation without preconditions. The EU’s retaliatory measures—tariffs on €93 billion of U.S. exports and restrictions on American market access—remain poised for activation on February 6 if no binding agreement emerges. Trump’s rhetoric on military action has softened, but lingering threats of intervention have sustained tensions, with Denmark (Greenland’s administering power) rejecting any sale outright. Trump’s overtures is viewed as tactical maneuvering amid domestic pushback, but the core dispute over territorial sovereignty persists, potentially prolonging economic friction into Q2 2026.

Higher oil price led by geopolitical tensions surrounding Venezuela and Iran

Oil prices in January 2026 exhibited sharp but ultimately contained volatility, driven primarily by geopolitical shocks in Venezuela and Iran. Early in the month, the US-backed ousting of Nicolás Maduro triggered a brief spike in WTI above $60/bbl as markets feared short-term supply disruptions from Venezuela’s roughly 800,000–1 million bpd output; however, prices quickly retreated as redirected exports (particularly to India and China) stabilized flows and the US Gulf Coast absorbed incremental barrels. Mid-month, nationwide protests in Iran and renewed US threats of military action against Iranian targets injected a risk premium, briefly lifting Brent above $66/bbl (highest since October 2025) on concerns over potential disruption to Iran’s ~3.3 million bpd production. By late January, both events de-escalated—Iranian authorities regained control and US rhetoric softened—causing the risk premium to unwind rapidly. WTI settled back into the mid-$50s to low-$60s range, Brent hovered around $63-$64/bbl, and the market ultimately reflected persistent global oversupply rather than sustained geopolitical disruption.

Japan government bond yield soars and batters stock market

Japan’s government bond yield spike in January 2026 — with the 10-year JGB yield surging to multi decade highs around 2.37–2.38% and super-long maturities (30–40 year) exceeding 4% — stemmed primarily from fiscal anxieties following Prime Minister Sanae Takaichi’s aggressive stimulus pledges ahead of the February snap election. Her “Sanaeconomics” platform, emphasizing food sales tax cuts and expansive spending, triggered fears of unsustainable debt issuance in a nation with debt-to-GDP exceeding 260%, prompting a sharp sell-off by bond vigilantes and weak auction demand. The January JGB yield surge acted as a potent but temporary drag on U.S. equities by pushing 10-year U.S. yields briefly above 4.31% and 30-year yields near 4.9%, unwinding carry trades, and contributing to intraday S&P 500 declines (-1.4% on Jan 20).

Prediction

1. Rate cut halt in January and continued postponement till Q2 unless more pronounced cracks of labor market emerge.

Despite evident cooling in labor market conditions, as reflected in subdued payroll figures, the concurrent decline in unemployment and ongoing hiring moderate the impetus for aggressive rate cuts. Furthermore, with shelter disinflation progressing gradually and tariff pass-through risks still material, the Federal Reserve is likely to await several months of core inflation readings nearer 2.3–2.5% before committing to further easing. We maintain that the Fed will initially allow the full price transmission of newly imposed tariffs to unfold and subsequently require clear, sustained evidence of inflation converging toward the 2% target before initiating a cutting cycle given the labor market is not heading towards the danger zone.

We project the peak CPI impact to materialize in Q2 2026 (April–June) based on the following rationale:

  • Pre-tariff inventory buffers, typically lasting 6–9 months across supply chains, will largely be depleted by Q1–Q2 2026, compelling retailers to fully pass through tariff costs to consumers by spring 2026.
  • Retailers are likely to absorb initial tariff impacts during the critical holiday and post-holiday seasons (November 2025–March 2026) to preserve margins and sales. The bulk of pricing adjustments will consequently reach shelves in April–June 2026, aligning with spring and summer restocking cycles.
  • Historical precedent (2018–2019 Trump tariffs) indicates that pass-through effects peaked approximately 7–8 months following implementation.

2.Gold maintains a structurally bullish trajectory.

Gold’s outlook for 2026 remains decisively bullish, as structural tailwinds—including sustained central bank accumulation, subdued real yields, geopolitical hedging demand, and portfolio reallocation—are far from exhausted. The Fed’s ongoing policy normalization should continue to suppress real yields, enhancing the appeal of non-yielding gold. Current allocations remain well below historical peaks (private holdings ~0.17% vs. ~0.23% peak; institutional holdings ~1–2% vs. ~4–5%+), indicating substantial room for increased investment demand. Central banks, particularly across Asia, continue to aggressively expand gold reserves as a hedge against currency depreciation, geopolitical instability (e.g., Greenland, Iran, Venezuela), and global debt escalation, and ongoing reserve diversification. The significant disparity in gold reserve ratios between emerging markets (e.g., China ~8%, India ~15–17%) and developed economies (U.S. ~74%, Germany/France/Italy ~60–70%), sustains central bank gold purchases in 2026, projected to stay elevated (700–900 tonnes range) , pointing to 2026 price target range of $4,900–$5,500+ per ounce.

3.The USD is on track for further depreciation.

The U.S. dollar (USD) is expected to experience continued depreciation by ~4–8% in 2026, driven by Fed rate cut anchor. Markets price ~25–50bp of Fed easing in 2026, while other major central banks (ECB, BoE, BoC) are expected to cut more slowly or pause earlier. If the Fed cuts interest rates as markets currently expect (to combat a potential economic slowdown), the yield advantage of holding USD assets diminishes. Lower yields reduce demand from international investors, putting downward pressure on the currency. The pace is likely to be gradual, uneven, and potentially punctuated by short-term rebounds or pauses rather than a straight-line decline, due to opposite effects of sticky inflation, delayed Fed cuts and AI-led strong U.S. growth resilience.

Disclaimer

All information used in the publication of this report has been compiled from publicly available sources that are believed to be reliable, however we do not guarantee the accuracy or completeness of this report and have not sought for this information to be independently verified. Forward-looking information or statements in this report contain information that is based on assumptions, forecasts of future results, estimates of amounts not yet determinable, and therefore involve known and unknown risks, uncertainties and other factors which may cause the actual results to be materially different from current expectations.

We shall not be liable for any direct, indirect or consequential losses, loss of profits, damages, costs or expenses incurred or suffered by you arising out or in connection with the access to, use of or reliance on any information contained on this note.