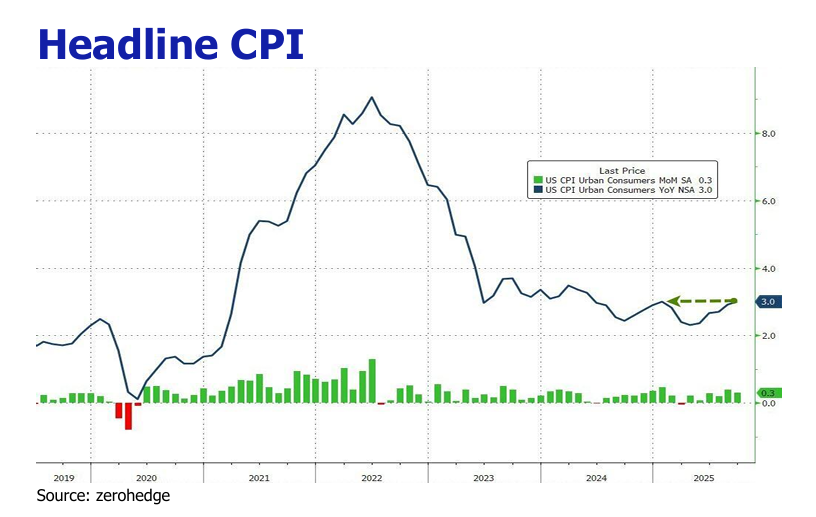
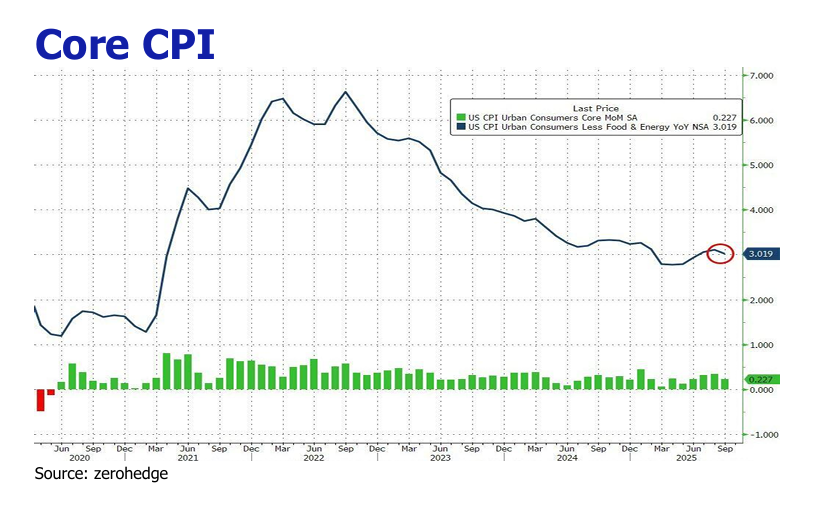
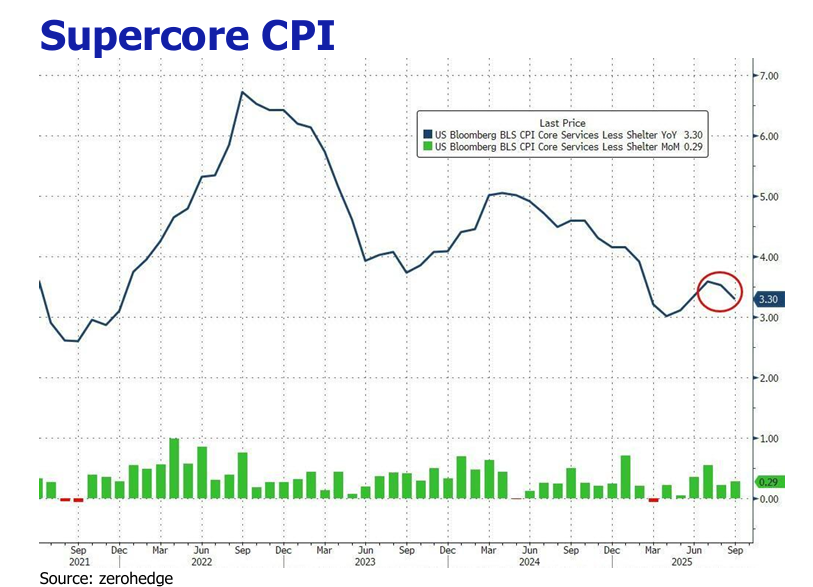
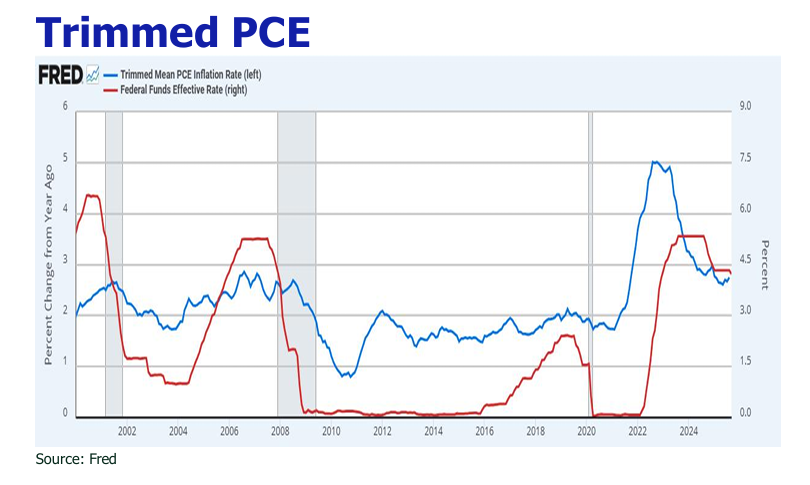
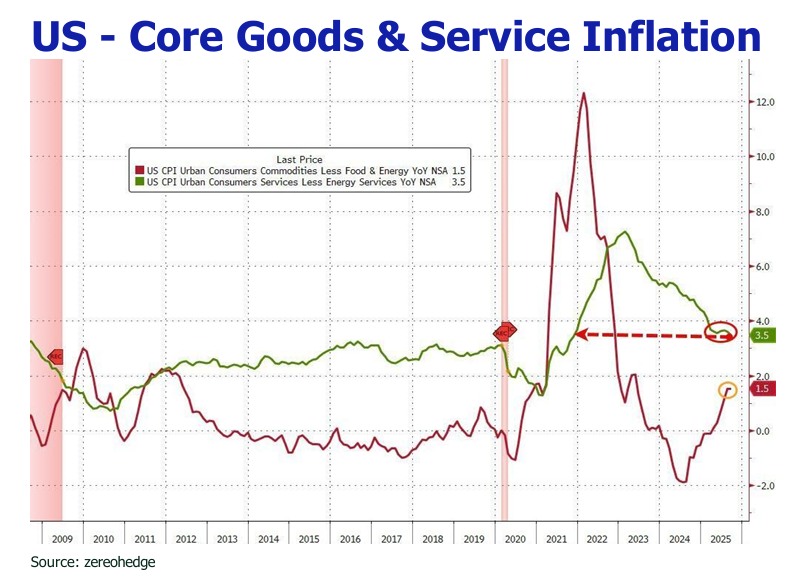
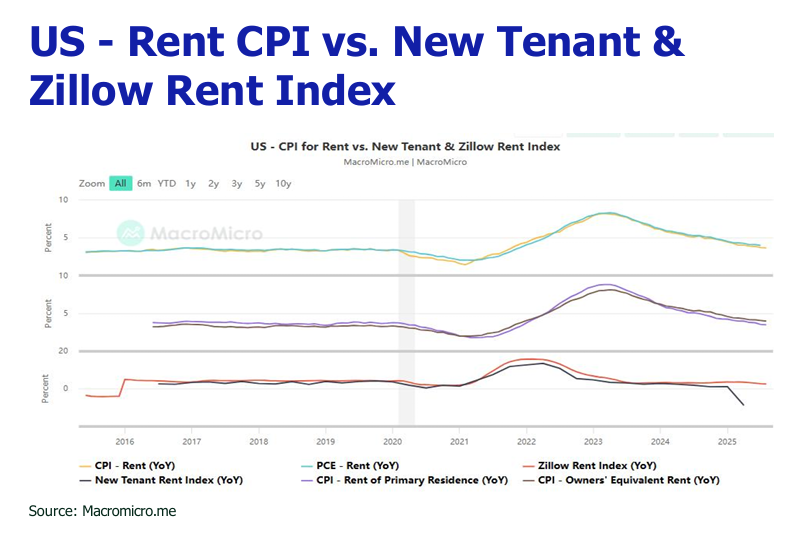
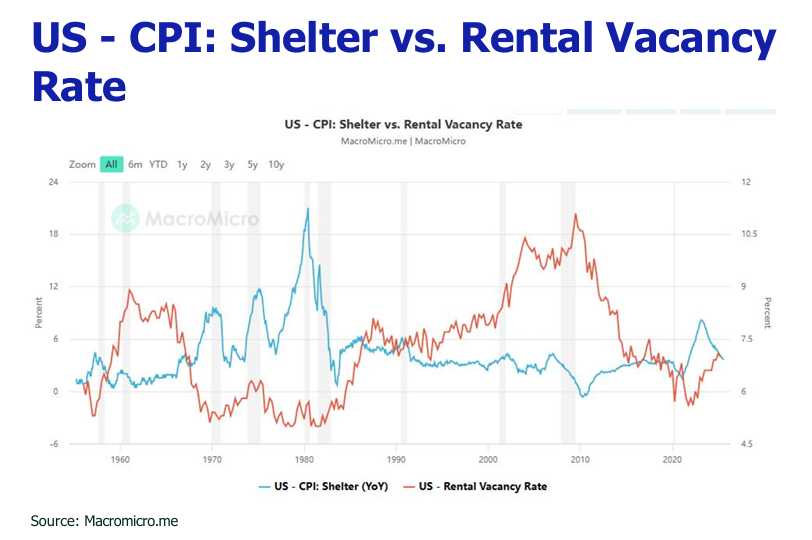
Walking a fine line with rate cut amid US-China agnostic economic tangle, court tariff battle and a subdued labor market
Austin Or, CFA
Highlights
US inflation pressure eased and tariff pass-through remained at the modest level.
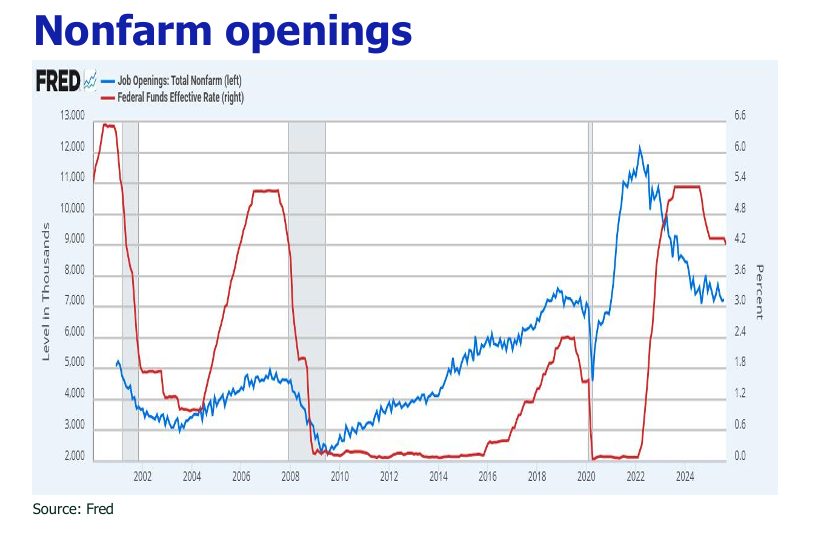
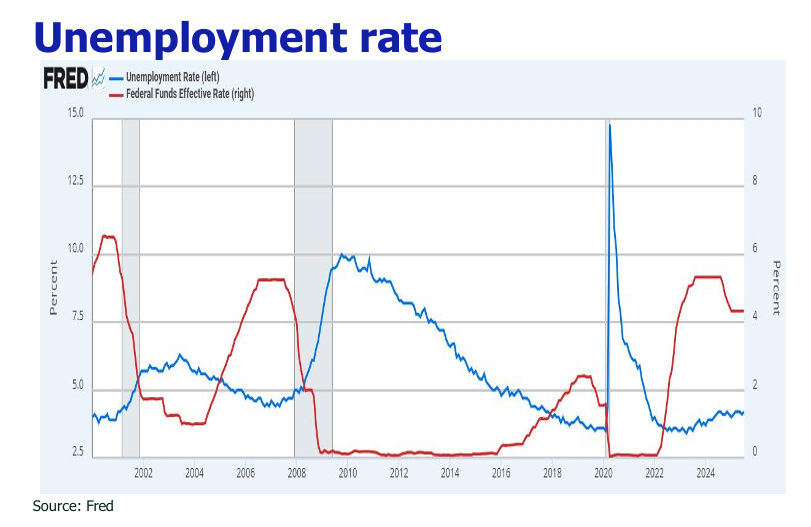
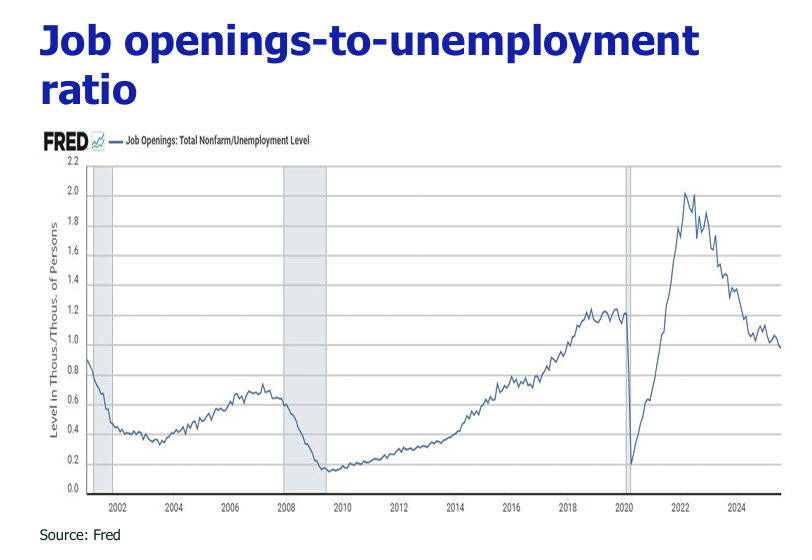
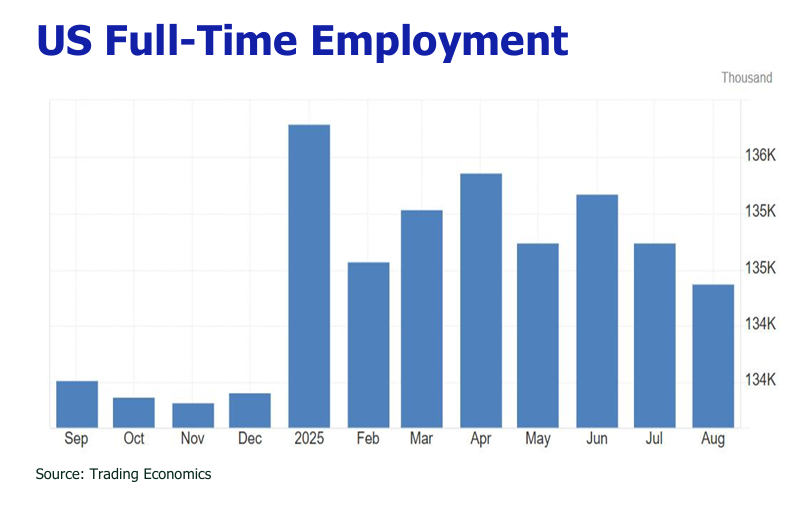
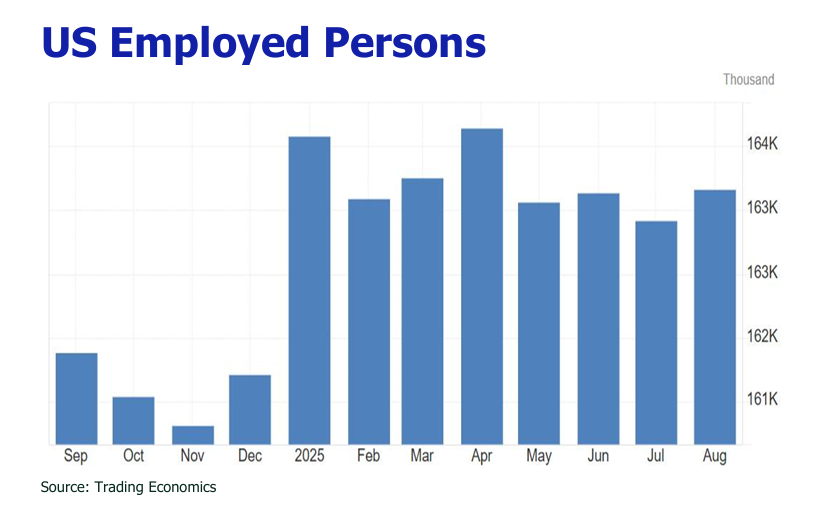
The September ADP unveiled a shrinking labor market, shedding 32,000 jobs—worst since March 2023—hitting small businesses hard in services and hospitality.
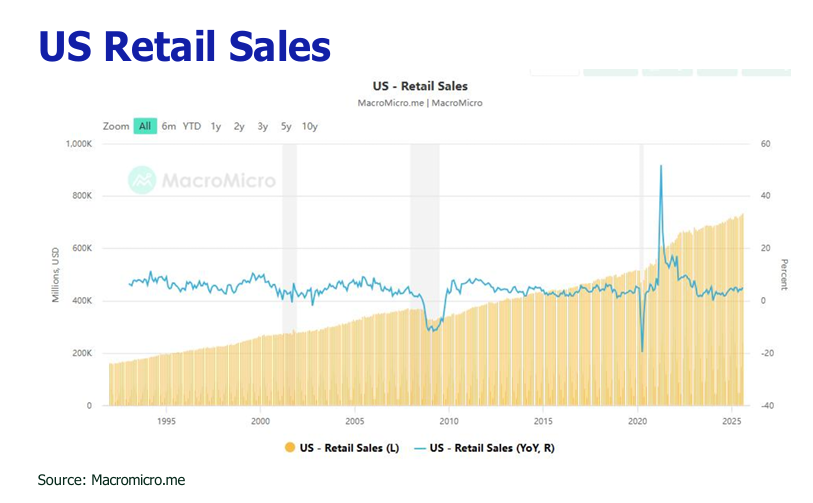
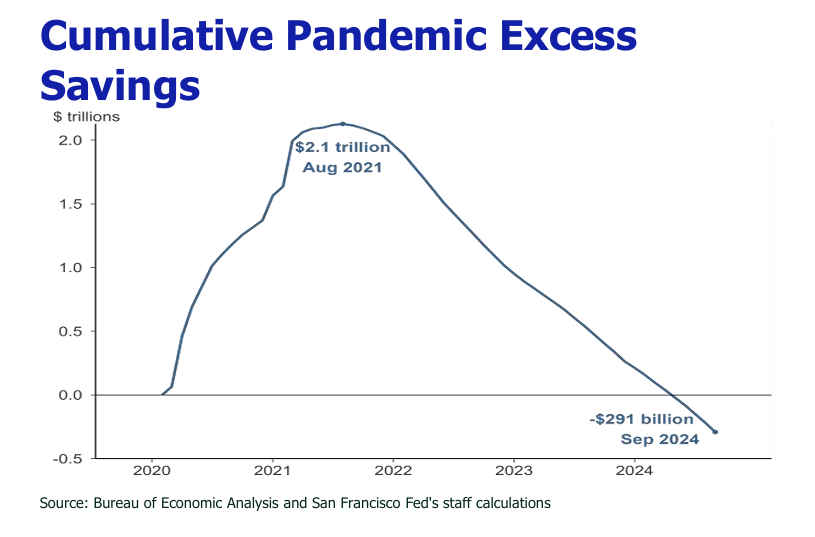
The CNBC/NRF Retail Monitor revealed a chic 0.66% dip in September 2025 sales (ex-autos/gas), yet a nice 5.42% yearly surge, outshining August, buoyed by wealth-fueled households.
October ignited a fiery US-China trade clash: China’s rare earth grip sparked Trump’s stratospheric 155% tariff threat, risking US tech shortages and GDP dips.
Tariff escalations of wood, steel, aluminum, kitchen cabinets, bathroom vanities, and medium and heavy-duty trucks exert new inflation pressure.
A Supreme Court ruling against Trump’s tariffs could trigger massive refunds, triggering 232/301 fallback amid delays.
APEC summit hints at rolling back 100% China tariffs and extending tariff truce on China, spurred by China rare earth dominance and US economic pressures.
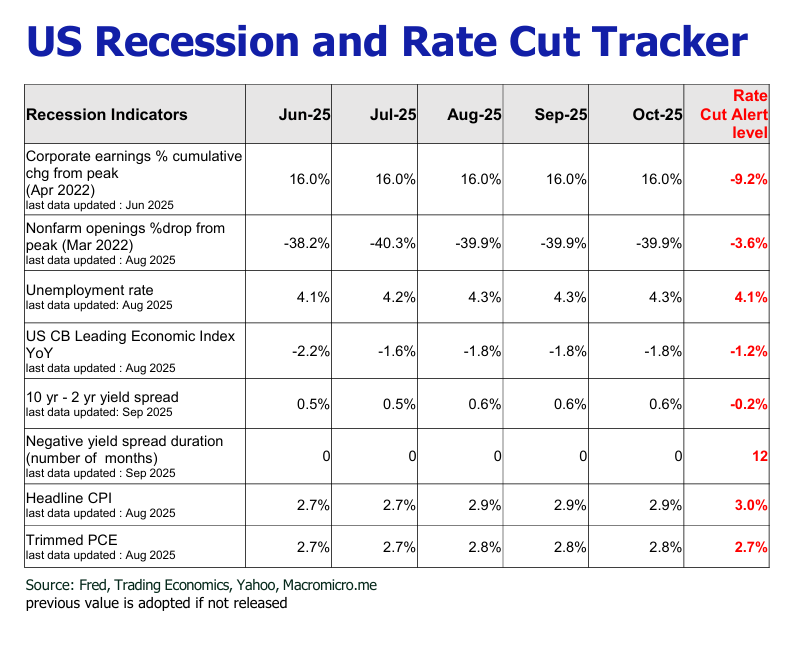
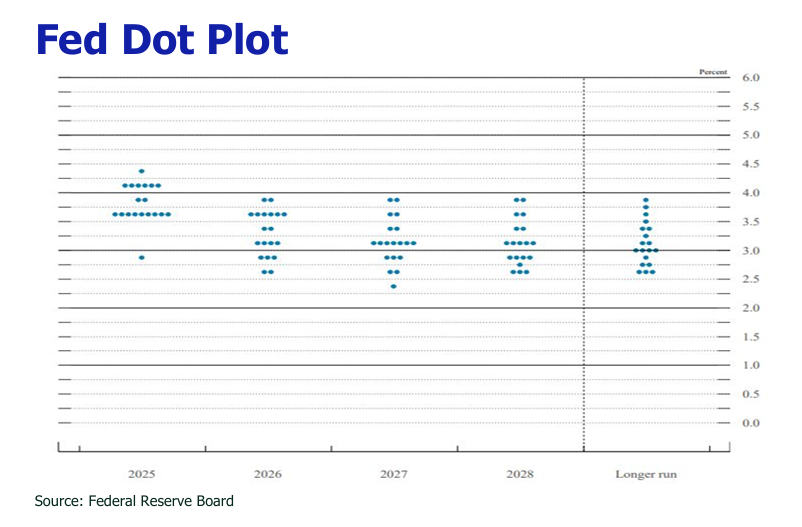
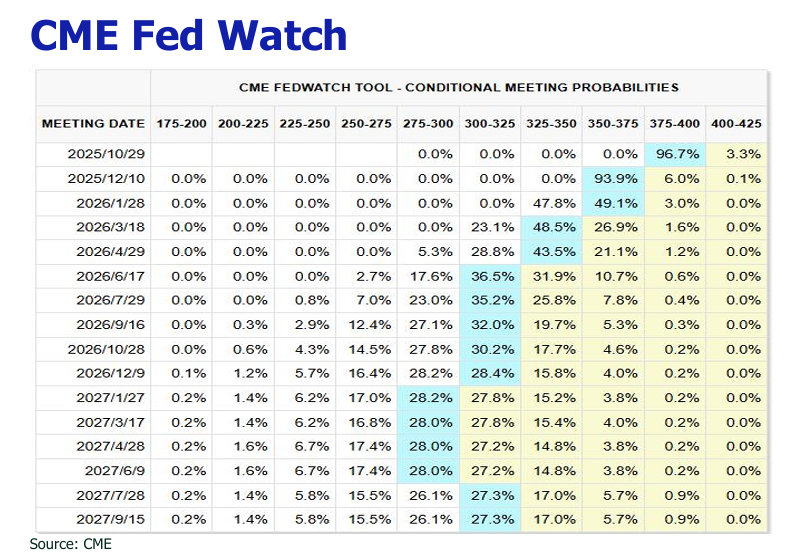
Slumping jobs and tariff relief pave the way for a 97%-likely 25bp Fed rate cut on October FOMC.
Golddazzles with a 40% leap past $4,000/oz in 2025, fueled by global chaos, inflation, and Fed cuts, eyeing $4,960–$6,000 by 2026.
October marked a turbulent descent for the HSI, plummeting over 4% month-to-date to around 26000 with shrinking daily volume to $200B-$250B in lower half month amid escalating US-China trade tensions and domestic policy uncertainties, reversing early-month gains and signaling renewed investor caution in Hong Kong’s markets.
US headline and core CPI rise less than expected
The September CPI report, delayed by a government shutdown and released on October 24, revealed inflation cooling to 3.0% YoY and 0.2% MOM (August 2.9% YoY, 0.4% MoM), below market expectation. The gasoline price index rose by 4.1% in September, which was the main driver of the overall price increase for the month, with the energy price index rising by 1.5%, up from 0.7% in August. Food and commodity inflation pressures were fairly muted with 0.2% and 0.5% increases respectively. Tariff effects seemed visible in some categories. Household furnishings rose 3.0% YoY (highest since mid-2023) and 0.4% MoM, apparel surged 0.7% MoM (largest since October 2024), while communication equipment climbed 1.6% YoY (most since 2021). Core CPI (excluding food/energy) rose 3.0% YoY and 0.2% MoM, coming lower than August’s readings of 3.1% YoY and 0.3% MoM, driven by moderated shelter cost. The shelter index (accounting 36% of total CPI), increased by 0.2%, with owners’ equivalent rent rising by 0.1%, marking the smallest monthly increase since January 2021.
September ADP signaled contraction in labor market
The September 2025 ADP report signaled a contracting labor market, with the release of nonfarm payroll data postponed due to a U.S. government shutdown. The ADP private-sector report showed a loss of 32,000 jobs, the steepest monthly decline since March 2023, down from August’s revised-3,000, driven by small businesses facing widespread losses in professional services and leisure/hospitality.
Retail sales growth stayed in the positive regime
The CNBC/NRF Retail Monitor reported a 0.66% seasonally adjusted month-over-month drop in total retail sales (excluding autos and gasoline) in September 2025, though a 5.42% unadjusted year-over year increase, compared to August’s 0.5% and 6.81% gains. Core retail sales (excluding restaurants, autos, and gasoline) declined 0.49% month-over-month but rose 5.72% year-over-year, versus August’s 0.26% and 6.67%, with growth sustained by higher-income households bolstered by robust financial and real estate wealth.
US-China tensions escalation
In October 2025, US-China trade tensions intensified, reigniting fears of a tariff war following a fragile truce. On October 9, China imposed export controls on five rare earth elements (holmium, erbium, thulium, europium, ytterbium) and related materials, tightening its grip on semiconductors, quantum devices, and electronics supply chains. This prompted President Trump to threaten 100% tariffs on all Chinese imports, potentially totaling 155% with existing duties, and key software (e.g. EDA, ADAS, OpenAI, Windows, Intel/AMD chip drivers) effective November 1. Concurrently, the US Commerce Department blacklisted thousands of Chinese subsidiaries and imposed port fees on Chinese vessels, while China retaliated with antitrust probes into Qualcomm and Nvidia, port fees on US ships starting October 14.
A newwaveofsweeping UStariffs risks spurring inflation
Apart from the 100% additional levy on Chinese imports effective November 1 (totaling 155%), the Trump administration intensified trade barriers with several new tariff impositions and expansions – 10% on softwood timber/lumber and 25% on kitchen cabinets, bathroom vanities, and upholstered furniture from all countries effective October 14, 25% on medium and heavy-duty trucks from all regions effective November 1, and steel/aluminum tariffs raised to 50% for EU, Canada, Mexico, Japan, and Australia effective October 26.
Potential impediment to Trump’s tariff policy by Supreme Court ruling
On November 5, the U.S. Supreme Court will hear oral arguments in challenging President Trump’s use of the International Emergency Economic Powers Act (IEEPA) to impose sweeping global tariffs. The Trump administration defended the tariffs as essential for addressing national security threats, including trade imbalances and drug trafficking, warning of “economic catastrophe” without them. Justices appeared divided, with conservative justices questioning the scope of executive power while liberals emphasized congressional primacy. If the Supreme Court rules that these tariffs are illegal, the US Treasury Department will have to return about half of the tariff revenue already collected (US$97.5B), and higher If the final ruling is postponed until June 2026. As a consequence, the administration would likely pivot to Section 232 (national security tariffs) or Section 301 (unfair practices tariffs), maintaining or reinstating duties on key sectors like steel, aluminum, autos, and Chinese goods. This fallback would sustain inflationary pressures and tariff revenue, though with procedural delays (3–6 months) and potential legal hurdles from Congress.
Prediction
1. Rollback and postponement of tariffs.
Discussions ahead of the October 31–November 1 APEC summit in South Korea suggest a strong likelihood of tariff de-escalation, with Treasury Secretary Scott Bessent and Trade Representative Jamison Greer optimistic about a Trump-Xi meeting to avoid the 100% tariff, potentially extending the August truce for 90 days while retaining 10% duties. Trump’s softened stance on October 17, calling the 100% tariff “not sustainable” supports this. Beyond the likely rollback of the 100% top-up, a suspension of 24 percentage points (per the May Geneva agreement) , driven by:
China’s rare earth dominance. With global dominance of 70% mining and 90% processing, China’s rare earth trade retaliation against US tariffs, threatens to disrupt US semiconductors, electric vehicles (EVs), defense systems, and renewable energy, potentially adding 20–30% to production costs, shaving 0.3–0.5% off US GDP in 2026, and inducing 0.1–0.3% surge to core CPI in Q4 2025.
Dwindledreliance on US export. Once reliant on US markets for 20% of its exports in 2018, China’s share has dwindled to less than 10% by September 2025, buoyed by a 8.3% total export growth despite a 27% plunge to the US, as Beijing pivots to robust trade with ASEAN, Europe, and Belt and Road partners. This diminished exposure—now under $500B annually—allows China to wield its dominance in rare earths (70% global mining, 90% processing) without fear of reciprocal economic pain.
2. 25bp Fed rate cut is convicted in October FOMC.
Given the slumping private and government job markets (targeting 275,000 federal job cuts this year, with 200,000 already achieved), modest tariff
-induced inflation, and the anticipated tariff rollback/postponement averting a spike, a 25bp rate cut at the October 28–29 FOMC meeting is ascertained. Markets currently price a 97% probability, per CME FedWatch Tool, lowering the funds rate to 3.75–4.00% from 4–4.25%.
3.Gold glitters on.
Gold prices have soared over 40% in 2025, surpassing $4,000 per ounce, driven by geopolitical tensions (e.g., Russia-Ukraine war, U.S. tariffs), heightened U.S. inflation, robust central bank demand (160–460 tonnes net purchases since Q2 2022), and Fed rate cuts. Over the past six months, this surge has lifted gold’s share in global reserves from 24% to 30%, while the U.S. dollar’s proportion fell from 43% to 40%. The World Gold Council’s 2025 survey reveals 43% of central banks plan to boost gold holdings (up from 29% in 2024), though gold allocations remain low at 2.3% for global institutions and 0.5% for private clients, fueling rising demand for diversification.
Global gold ETFs and COMEX futures have amassed 788 tonnes and 116 tonnes respectively (total 904 tonnes) in the current bull cycle, trailing the 2009–2012 (2,286 tonnes) and 2016–2020 (3,147 tonnes) peaks. Assuming annual central bank purchases of 640 tonnes and additional ETF/COMEX accumulation of 1,382–2,243 tonnes (excluding private demand), total demand could reach 2,022–2,883 tonnes. Goldman Sachs estimates each 100 tonnes of new buying lifts gold prices by 1.5–2%, suggesting a potential 21–44% upside to $4,960–$5,900. Investment banks hold bullish views on gold: J.P. Morgan forecasts an average of $5,055/oz by Q4 2026, Goldman Sachs targets $4,900/oz by year-end 2026, and Bank of America predicts a peak of $6,000/oz by spring 2026, reflecting stagflation and dollar weakness.
Disclaimer
All information used in the publication of this report has been compiled from publicly available sources that are believed to be reliable, however we do not guarantee the accuracy or completeness of this report and have not sought for this information to be independently verified. Forward-looking information or statements in this report contain information that is based on assumptions, forecasts of future results, estimates of amounts not yet determinable, and therefore involve known and unknown risks, uncertainties and other factors which may cause the actual results to be materially different from current expectations.
We shall not be liable for any direct, indirect or consequential losses, loss of profits, damages, costs or expenses incurred or suffered by you arising out or in connection with the access to, use of or reliance on any information contained on this note.