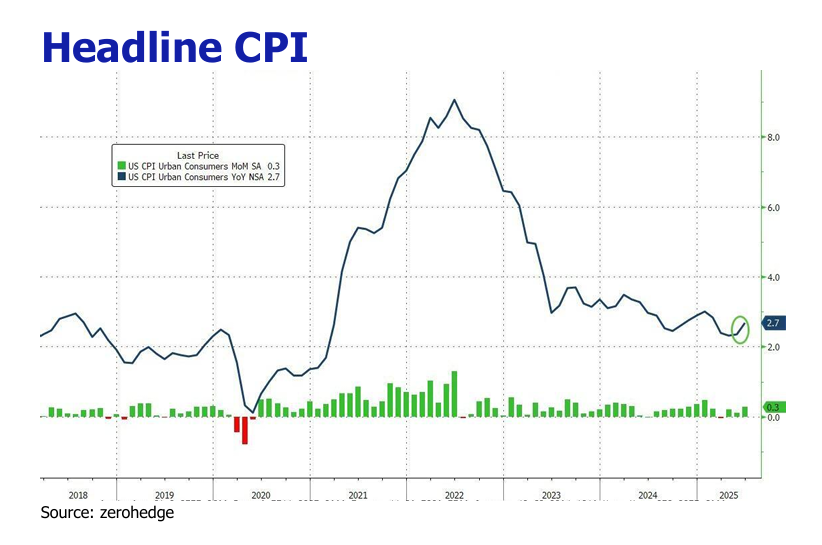
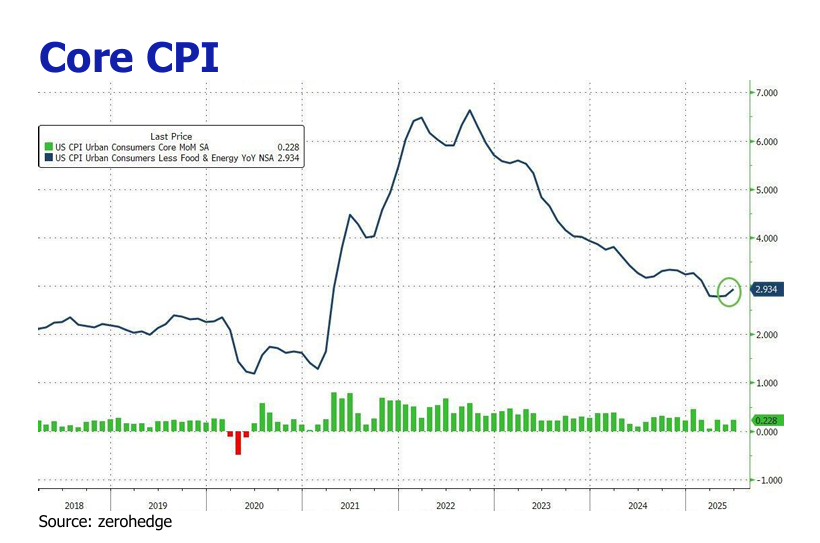
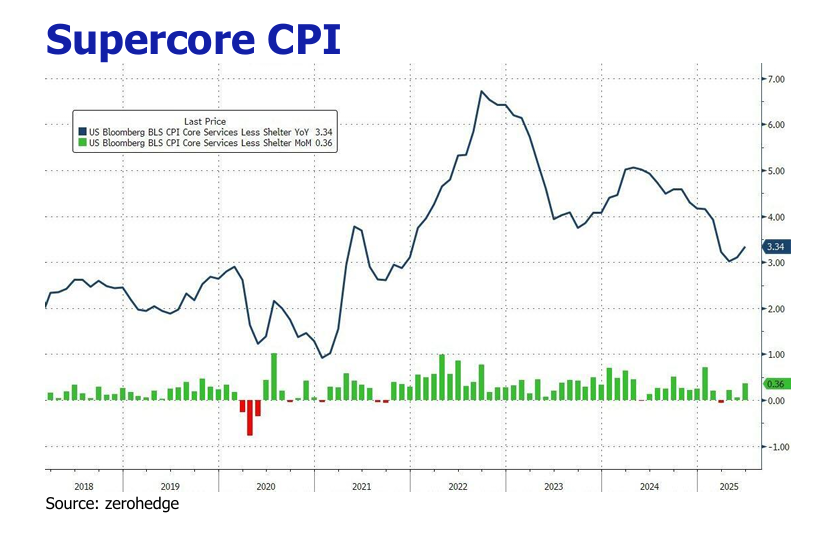
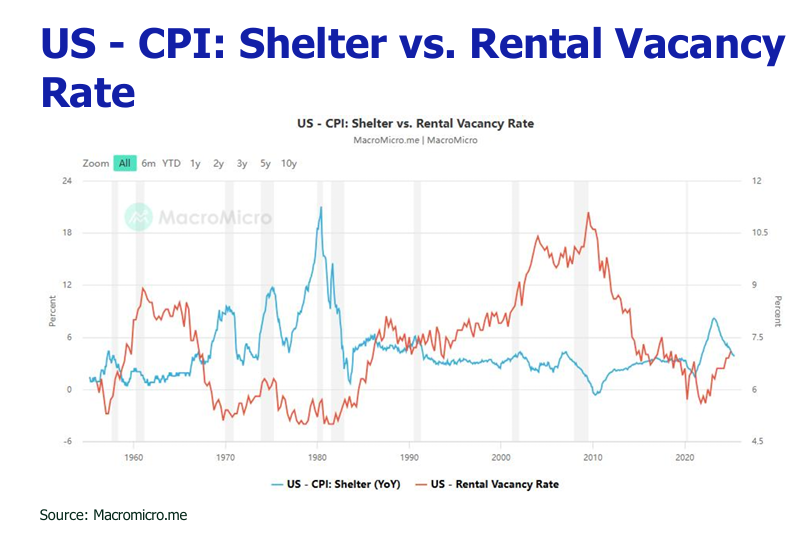
Beautiful Act and AI Plan Spark New Dawn For U.S. Economy and Direr Fiscal Deficit Gap

Austin Or, CFA

Highlights

June CPI rose 0.3% MoM and 2.7% YoY, with tariff-sensitive sectors driving inflation, moderated bystrategic imports from Mexico and Vietnam.
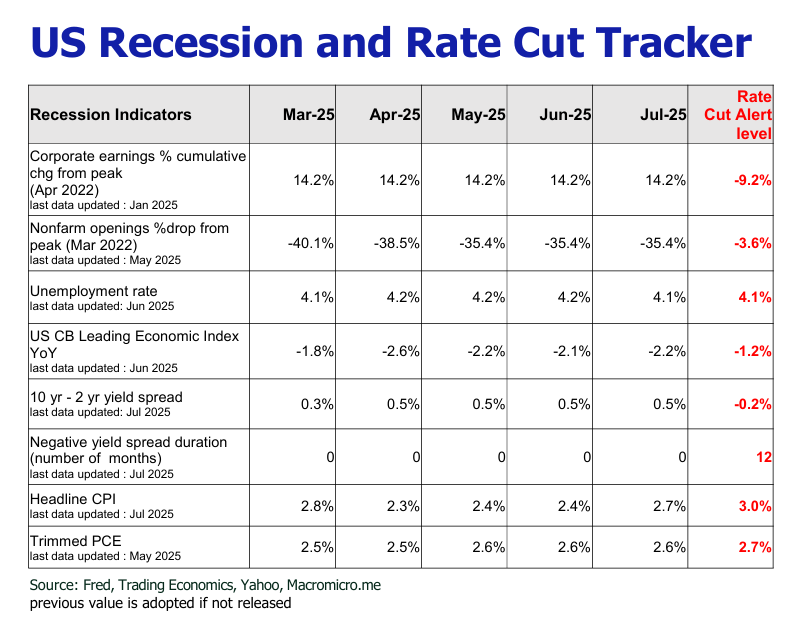
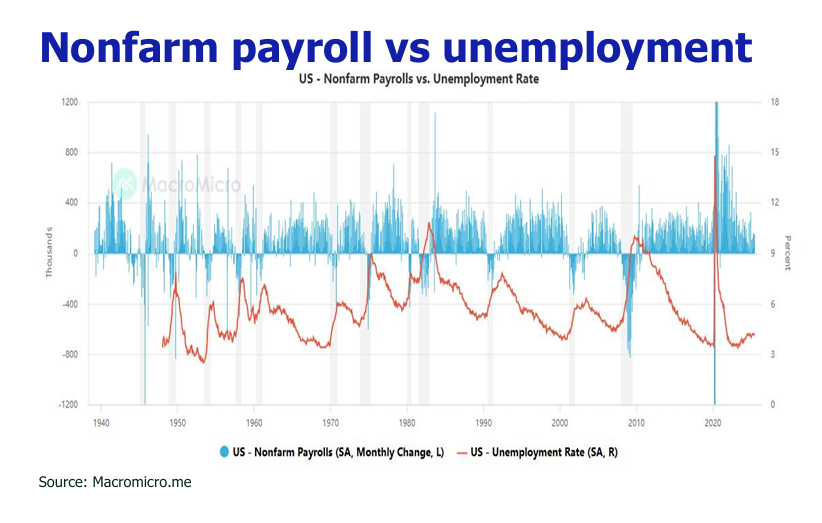
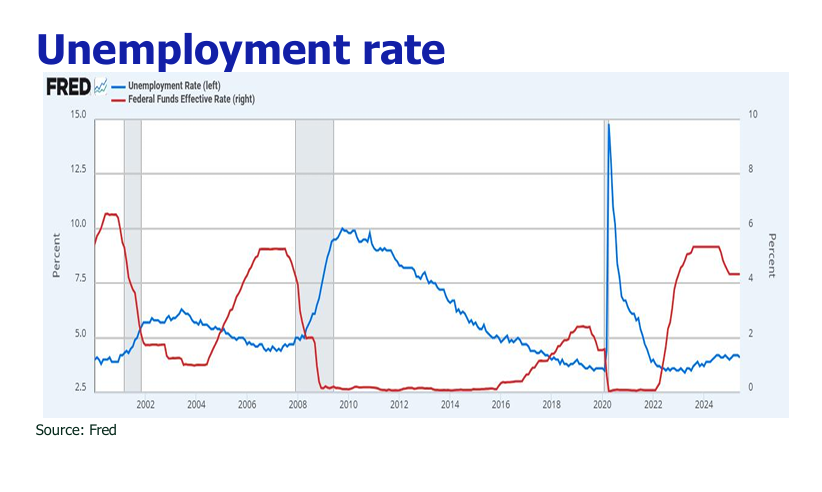
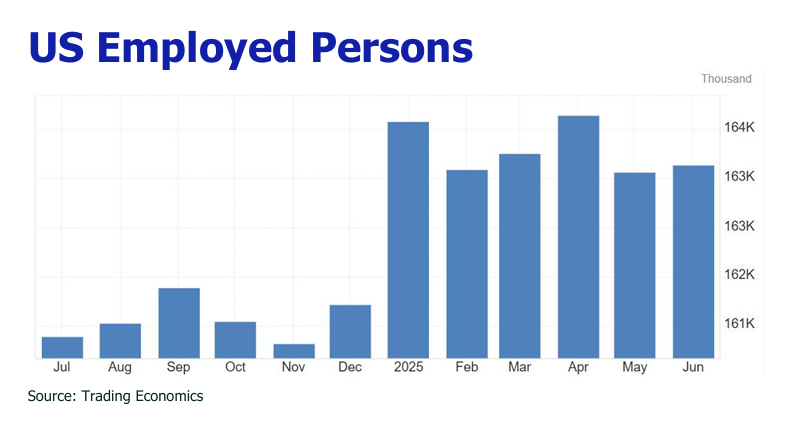
June nonfarm job growth of 147,000 was led by public sector hiring, with private sector weakness and a labor force contraction masking unemployment decline to 4.1%.
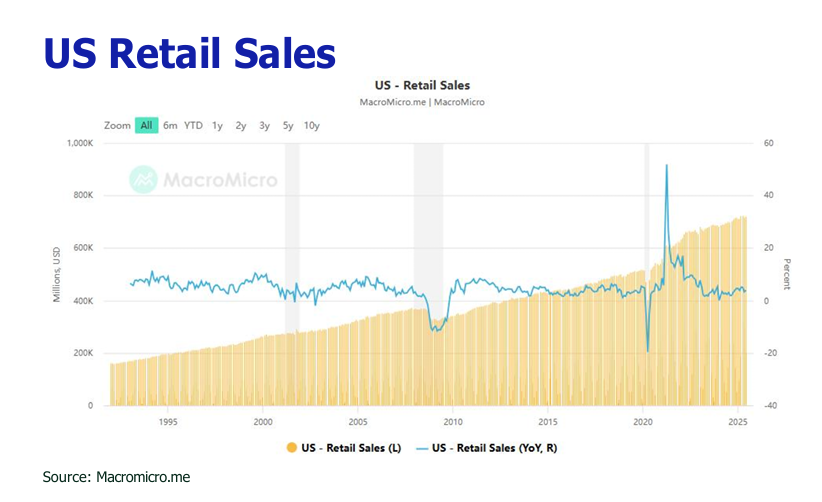
Retail sales grew 0.6% in June, driven by tariff-induced price increases, with real growth at 0.3% after CPI adjustment.

Tariff agreements with Japan and the EU (both 15%) diminish tariff uncertainty, with exemptions and negotiations ongoing (e.g. China, India, South Korea) before August 1 deadline.

One Big Beautiful Bill Act (OBBBA) ’s tax cuts, increased funding for key sectors, and $5 trillion debt ceiling hike aim to boost GDP (est. 1.5–2.3% annually) and support US Treasury financing.

The AI Action Plan promotes U.S. AI leadership through loosening exports, encourage infrastructure investment, tightening export controls on advanced technologies, and establishing American technology as the global benchmark.

GENIUS and CLARITY Acts regulate stablecoins and digital assets, enhancing financial system integration and investor protections.

Escalating tariffs and the Beautiful Act are poised to heat up inflation and strain labor market.

OBBBA’s $2.4–$5.0 trillion deficit increase and $554 billion Q3 Treasury issuance weaken USD amid downgrade risks.
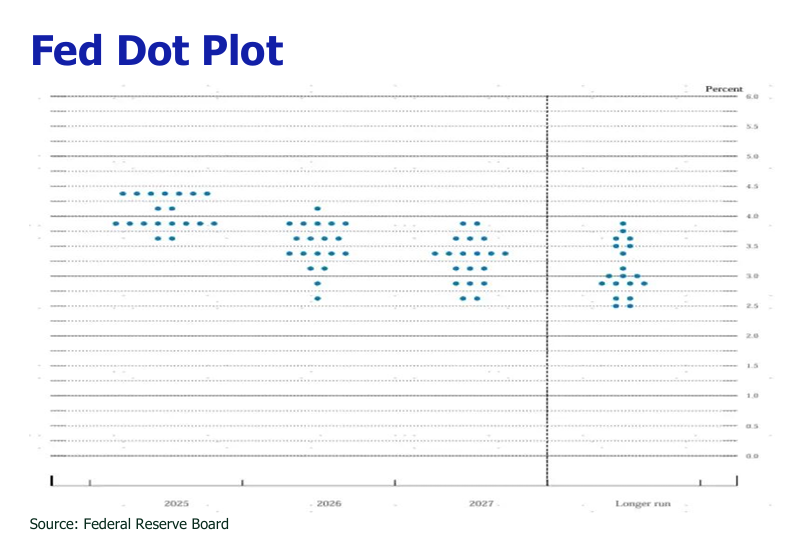
Persistent inflation and labor market resilience delay rate cuts, with Powell’s tenure under scrutiny potentially altering rate cut path.

OBBBA and AI Action Plan bolster tech and AI sectors, but tariffs and liquidity drain from Treasury issuance threaten Q3 market stability.

In July 2025, the HSI exhibited robust growth, reaching a 3.5-year high above 25,000 points, driven by foreign fund inflows, positive trade developments, and optimism in Tech and Healthcare sectors, with daily volume of HK$190-340B.

Tariff-Induced Inflation Escalates

In June 2025, the Consumer Price Index (CPI) ascended by 0.3% month-on-month (MoM), registering a year-on-year (YoY) surge of 2.7%, the most pronounced in four months. Core CPI, excluding volatile food and energy constituents, advanced by 0.23% MoM and 2.9% YoY, slightly undercutting projections. The “super core” CPI, which omits housing-related service expenditures, escalated by 0.36% MoM and 3.34% YoY, the steepest increment since February. Sectors susceptible to tariffs exhibited significant MoM price elevations: household furnishings and supplies rose by 0.98%, apparel by 0.43%, recreational goods by 0.77%, household food prices by 0.3%, and energy prices by a formidable 0.9%. The moderated core CPI spike was attenuated by declines in used cars and trucks (-0.7% MoM), new vehicles (-0.3% MoM), airfares (-3.5% YoY), and a persistent abatement in housing inflation (0.18% MoM). Strategic preemptive importation, heightened reliance on tariff-exempt goods from Mexico under the USMCA, and cost-effective products from Vietnam partially ameliorated price pressures.

Labor Market Expansion Reliant on Public Sector

The Bureau of Labor Statistics reported a net accretion of 147,000 jobs in June 2025, with the unemployment rate declining to 4.1%. However, public sector recruitment predominated, with government positions surging by 73,000, constituting nearly half of total job accretion. Conversely, private sector employment eked out a modest 74,000 jobs, the most anemic growth since October 2024. Tariff-induced cost escalations curtailed private sector hiring, notably in manufacturing, which contracted by 7,000 jobs. The unemployment rate’s ostensible decline was illusory, driven by a 755,000-person contraction in the labor force, partly attributable to stringent immigration policies diminishing workforce participation. Wage dynamics underscored a cooling labor market, with average hourly earnings rising by a restrained 0.2% MoM and 3.7% YoY, decelerating from May’s 0.4% MoM increase.

Defying Tariff-Led Inflation, Consumer Spending Shows Surprising Strength

Retail sales burgeoned by 0.6% in June, rebounding from an unrevised 0.9% contraction in May. Core retail sales, excluding automobiles, gasoline, building materials, and food services, advanced by 0.5%, following a downwardly revised 0.2% gain in May. However, this broad-based upsurge was predominantly driven by tariff-induced price elevations rather than volumetric growth. After adjusting for June’s 0.3% CPI increase, real retail sales growth moderated to 0.3%. Importers’ partial absorption of tariff costs has enabled consumers to navigate escalating prices, thereby sustaining expenditure levels.

Sealing Key Country Trade Deals and Slapping New Commodities Tariffs

In July, Trump prolonged the moratorium on additional “reciprocal” tariffs from July 9 to August 1, affording transient market respite, while reaching deals with major trading partners. A seminal trade accord with Japan, the U.S.’s fifth-largest trading partner, reduced tariffs on Japanese exports (e.g., automobiles, comprising 28.3% of U.S. imports) from a proposed 25% to 15%, effective August 1. In return, Japan pledged $550 billion in investments to U.S. sectors, including semiconductors, pharmaceuticals, and AI, with the U.S. retaining 90% of profits. Japan also committed to augmenting imports of U.S. automobiles, trucks, and agricultural products, notably rice, addressing entrenched market barriers. The US also ended a months-long standoff with EU by welding EU tariff at 15%, together with $600bn the EU investment in the US, purchase of American military equipment, and $750bn spend on energy. Apart from Japan and the EU, Trump confirmed to slash 35% on Canada, 20% on Vietnam, 50% on Brazil, 30% on Mexico and up to 36% on Southeast Asian nations, with negotiations with other key trading partners including China, India and South Korea ongoing. To fortify national security and domestic production, tariffs of 50% on copper and 93.5% on Chinese graphite were imposed, with prospective tariffs on pharmaceuticals (up to 200%) and semiconductors (25% or higher) under contemplation.

One Big Beautiful Bill Act (OBBBA) Propels Economic Vigor

Enacted on July 4, the OBBBA seeks to galvanize the U.S. economy through enduring tax reductions and targeted sectoral allocations. Salient provisions include perpetuating the 2017 Tax Cuts and Jobs Act, elevating the state and local tax (SALT) deduction cap, augmenting semiconductor companies’ tax exemptions from 21% to 35%, and permitting 100% bonus depreciation for short-lived assets and permanent R&D expensing. Enhanced funding will shower to traditional energy, manufacturing, real estate, border security, defense, and agriculture, while clean energy, electric vehicles, food benefits, and healthcare face curtailed allocations. The act also elevates the debt ceiling by $5 trillion to $40 trillion, averting fiscal default. These measures are projected to catalyze GDP growth of 1.5–2.3% annually, per Congressional Budget Office and Federal Reserve estimates, by stimulating consumption and corporate earnings.

AI Action Plan Entrenches U.S. Preeminence in Artificial Intelligence

Unveiled in July, the AI Action Plan encompasses over 90 policy initiatives to cement U.S. hegemony in AI vis-à-vis competitors like China. The Commerce and State Departments will collaborate with industry to export secure, comprehensive AI solutions—encompassing hardware, models, software, and standards—to allied nations, establishing American technology as the global benchmark. The plan expedites permits for AI supercomputer data centers by attenuating environmental regulations and leverages federal land to accelerate development, addressing AI’s prodigious energy demands. Rigorous export controls on advanced AI chips and computing technologies aim to preclude access by adversaries, including China, Iran, North Korea, and Russia.

GENIUS And CLARITY Acts Herald A Crypto Epoch

Passed in July, the GENIUS and CLARITY Acts furnish a robust regulatory framework for digital assets. The GENIUS Act governs stablecoin issuance, integrating them into mainstream financial systems (payments, settlement, remittances, treasury management) and potentially amplifying demand for U.S. Treasuries via reserve requirements. The CLARITY Act delineates digital assets as securities, commodities, or stablecoins, reassigns oversight to the Commodity Futures Trading Commission, streamlines regulations, and establishes lucid protocols for trading, registration, and custody to fortify consumer and investor protections.

Prediction

1.Top-up Tariffs And Beautiful Act Agitate Inflation And Weigh On Labor Market.

The confluence of escalating tariffs and the Beautiful Act is intensifying inflationary dynamics and destabilizing the labor market. With reciprocal tariffs set to recommence after August 1, 2025, and U.S. enterprises increasingly internalizing tariff-related costs, the third quarter of 2025 is poised for pronounced inflationary surges. Newly imposed duties on critical commodities such as copper and graphite, alongside elevated energy costs triggered by the OBBBA’s revocation of clean energy incentives, compound these economic challenges.The OBBBA’s stringent reductions to Medicaid and the Supplemental Nutrition Assistance Program (SNAP), combined with tariff-induced price escalations, deepen labor market vulnerabilities. Private sector job growth has stagnated at a mere 74,000, while manufacturing has contracted by 7,000 jobs. The elimination of clean energy incentives jeopardizes over 800,000 jobs, with projections indicating contractions of 4.1% in construction, 0.8% in agriculture, and 2.9% in advanced manufacturing. These sectoral declines threaten to precipitate widespread layoffs, further imperiling economic stability.

2. Fiscal Deficits And USD Are Deeper Under Water.

The Congressional Budget Office projects OBBBA will augment deficits by $2.4 trillion (2026–2035), or $3.0–$3.4 trillion with interest, potentially
escalating to $5.0 trillion if temporary provisions are extended. Tariffs are anticipated to yield $2.4 trillion in revenue, partially offsetting deficits, but net debt increases of $0.7–$2.6 trillion loom. The larger debt burden will demand increased Treasury issuance to fund persistent deficits. Moody warns of potential U.S. credit rating downgrades due to rising deficits and debt loads. Higher deficits and downgrade risks weaken the USD long-term, as investors demand higher yields to hold U.S. debt, reducing foreign demand for dollar-denominated assets.

3. Rising CPI Reinforces Fed Caution But Rate Cut Vagary Remains.

Despite President Trump’s exhortations for Federal Reserve Chair Jerome Powell to expedite rate cuts, markets anticipate procrastination due to persistent inflation (core PCE at 3.2%) and a resilient labor market. Powell’s tenure, secure until May 2026, faces scrutiny from allegations tied to a $2.5 billion Federal Reserve renovation project. A potential dismissal or acquiescence could precipitate premature rate cuts, injecting uncertainty.

4. Tariffs, OBBBA, AI Action Plan and Liquidity Conundrums May Hinder Q3 Bull Run.

The OBBA’s sweeping tax incentives, coupled with the AI Action Plan’s prodigious investments—such as $90 billion allocated to Pennsylvania and a monumental $500 billion from OpenAI and SoftBank—invigorate a robust risk-on sentiment, particularly galvanizing tech titans like Amazon, Google, Meta, and Microsoft. These initiatives are poised to catalyze cash flow accretions ranging from $10–25 billion in FY25 for each of Amazon, Google, Meta by Morgan Stanley, fortifying the AI infrastructure and semiconductor sectors. Nevertheless, tariff-induced cost escalations threaten to constrict consumer expenditure, squeeze margins for retailers and manufacturers, and provoke retaliatory tariffs that undermine U.S. export competitiveness, potentially precipitating a 2–3% decline in S&P 500 earnings. Compounding this, the third quarter’s liquidity contraction, driven by a formidable $554 billion in Treasury issuance, emerges as a salient counterforce, tempering the bullish momentum and casting a shadow over the market’s near-term trajectory.

Disclaimer

All information used in the publication of this report has been compiled from publicly available sources that are believed to be reliable, however we do not guarantee the accuracy or completeness of this report and have not sought for this information to be independently verified. Forward-looking information or statements in this report contain information that is based on assumptions, forecasts of future results, estimates of amounts not yet determinable, and therefore involve known and unknown risks, uncertainties and other factors which may cause the actual results to be materially different from current expectations.

We shall not be liable for any direct, indirect or consequential losses, loss of profits, damages, costs or expenses incurred or suffered by you arising out or in connection with the access to, use of or reliance on any information contained on this note.